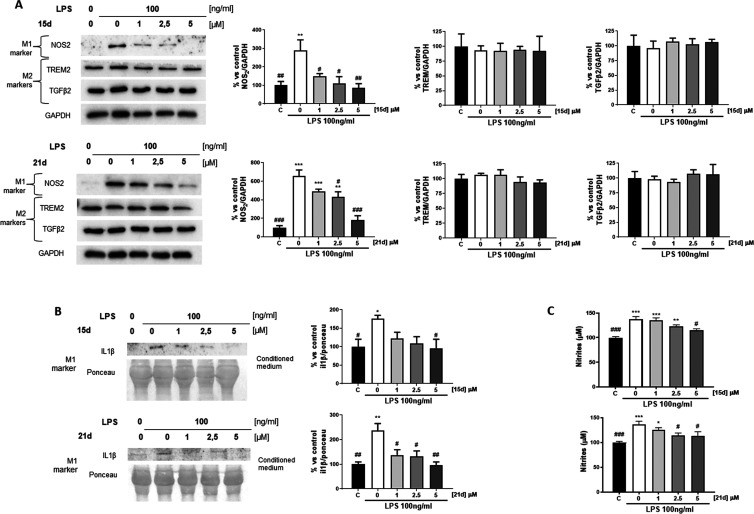
Figure 6.
Effects of compounds 15d and 21d on microglia activation in N9 cells after LPS (100 ng/mL) treatment in the presence of increasing concentrations (1, 2.5, and 5 μM) of compounds 15d and 21d. (A) Expression of iNOS, TREM2, and TGFβ2 was evaluated by Western blot analysis (left) and quantified through densitometry; (B) IL1β release was measured by Western blot analysis and quantified through densitometry; and (C) nitrite release was quantified using the Griess test. All quantitative data are presented as means ± SEM from at least three independent experiments. Statistical significance between different treatments was calculated by using one-way analysis of variance (ANOVA) followed by post hoc comparison through Bonferroni’s test. #p < 0.05, ##p < 0.01, ###p < 0.001, compared to LPS-activated microglia; *p < 0.05, **p < 0.01, and ***p < 0.001, compared to control; two-way ANOVA (Dunnett’s post hoc comparison test).

