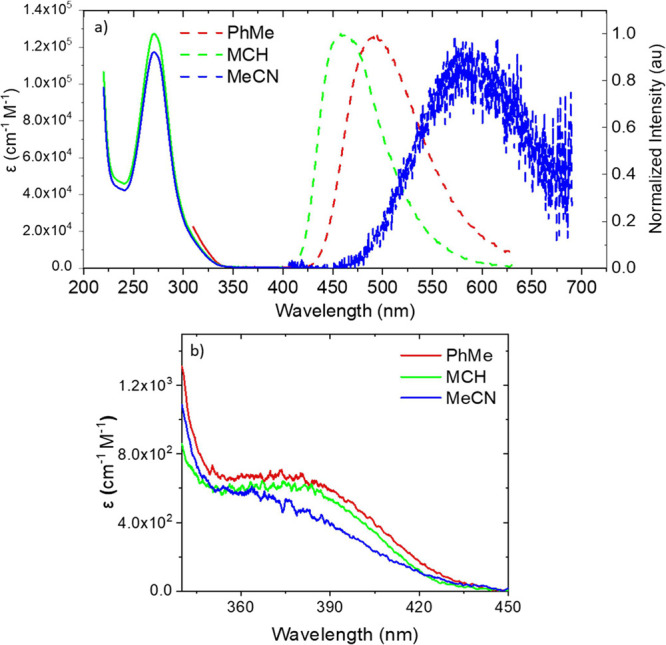
Figure 2.

(a) Solution-state PL measurements, solid lines correspond to absorption and dashed lines correspond to emission (toluene absorption spectra were only 310 nm because of the solvent cutoff). (b) Absorption in the spectral region of 340–440 nm showing a weak solvent-dependent direct charge transfer transition below the lowest energy ππ* transition.
