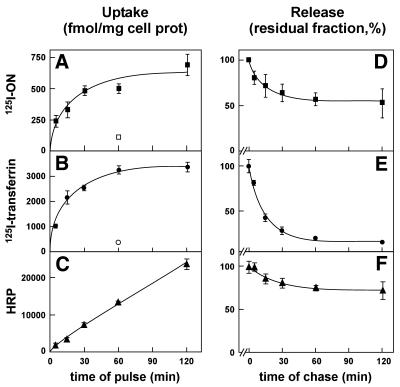
Figure 1.
Comparison of the kinetics of 125I-ON endocytosis and efflux with those of receptor-mediated and fluid-phase endocytic tracers. HepG2 cells were incubated at 37°C for the indicated times of pulse (A–C) or for 1 h (D–F) with 1 ml serum-free medium supplemented with either 125 nM 125I-ON (A and D), 62 nM 125I-transferrin (B and E), or 100 µM HRP (C and F) prior to washing and surface-protease digestion at 4°C, either without (A–C) or after chase in tracer-free medium for the indicated times (D–F). Pronase-resistant values (representing 30–50% of total cell-associated radioactivity for 125I-ON, ∼55% for 125I-transferrin and essentially all cell-associated HRP activity) were normalised to the cell protein content in the lysate of each dish. These ratios are represented in A–C in absolute amounts and a D–F as a residual fraction, expressed as percentages of level at time 0 of chase. These experiments were reproduced two or three times and yielded comparable kinetics. Data shown are from a representative experiment and are means ± SD of three dishes. Curves were drawn after (i) non-linear fitting (A and B) based on the hyperbola U = Umax × x / (Ku + x), where U is actual uptake at a given time; Umax is the steady state accumulation, corresponding to 686 and 3367 fmol/mg cell protein, respectively, Ku is the half-time for saturation of uptake (15 and 13 min, respectively) and x is the actual time (min); (ii) linear regression (C); or (iii) non-linear fitting to a mono-exponential decay (D–F; for parameters, see Results).

