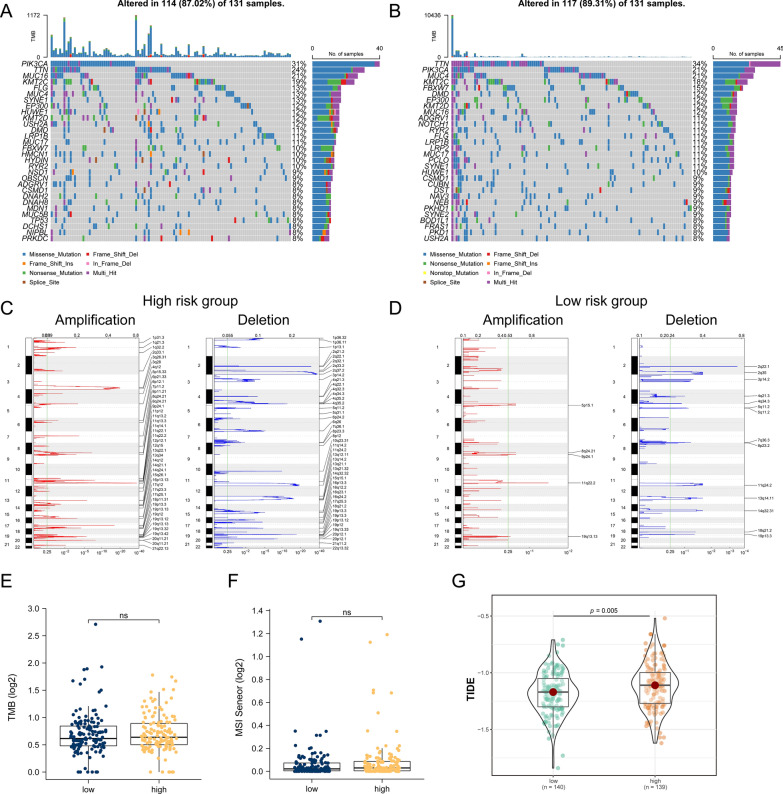
Fig. 8.
The effect of circadian rhythm-related risk grouping on genetic variation and immunotherapy in CESC patients. A–B are mutational profiles of common tumorigenesis driver genes in high- and low-risk groups of patients. Mutation information for each gene in each sample is shown in a waterfall plot, with various colors indicating different mutation types; subsections above the legend show mutational load; C–D are changes in copy number levels of different genes in patients in high and low risk groups, in which red is the gene with significantly increased copy number, and blue is the gene with significantly deleted copy number; E–F are the differences in TMB and MSI levels of patients in the high and low risk groups, respectively; G is the TIDE score calculated based on the TIDE database Differences in high and low risk groups

