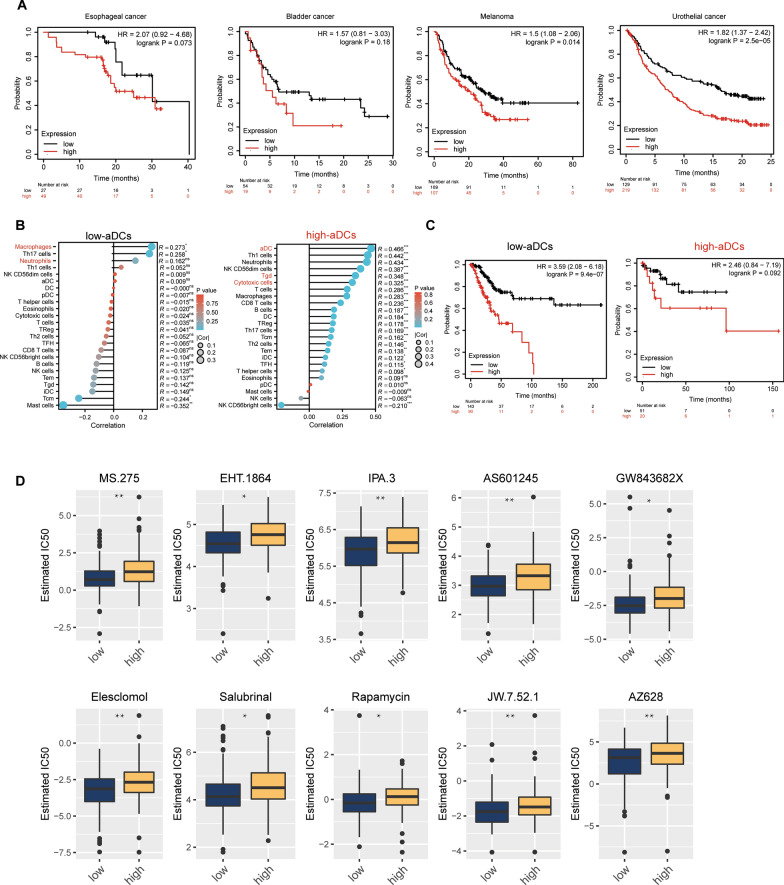
Fig. 9.
Immunotherapy prognosis and drug sensitivity analysis of circadian rhythm-related high- and low-risk groups. A are the survival plots of patients separated by the risk model in different immunotherapy cohorts; B is ssGSEA analysis of immune infiltration patterns of different patients separated by CIBERSORT scores of aDC expression (low and high by mean expression); C is survival plot of patients separated by CIBERSORT scores of aDC expression in TCGA-CESC (number = 304); D is according to the wilcox test comparing the drug IC50 of high and low risk groups, the top 10 drugs with p value are MS.275, EHT.1864, IPA.3, AS601245, GW843682X, Elesclomol, Salubrinal, Rapamycin, JW7.52.1, AZ628. These drugs all showed higher sensitivity in the low-risk group than in the high-risk group. Statistical analyses in (D) were calculated by non-parametric student-t test analysis between low and high risk groups’ estimated IC50 values. *: P < 0.05; **: P < 0.01; ***: P < 0.001. *: P < 0.05; **: P < 0.01; ***: P < 0.001; ns: no significance

