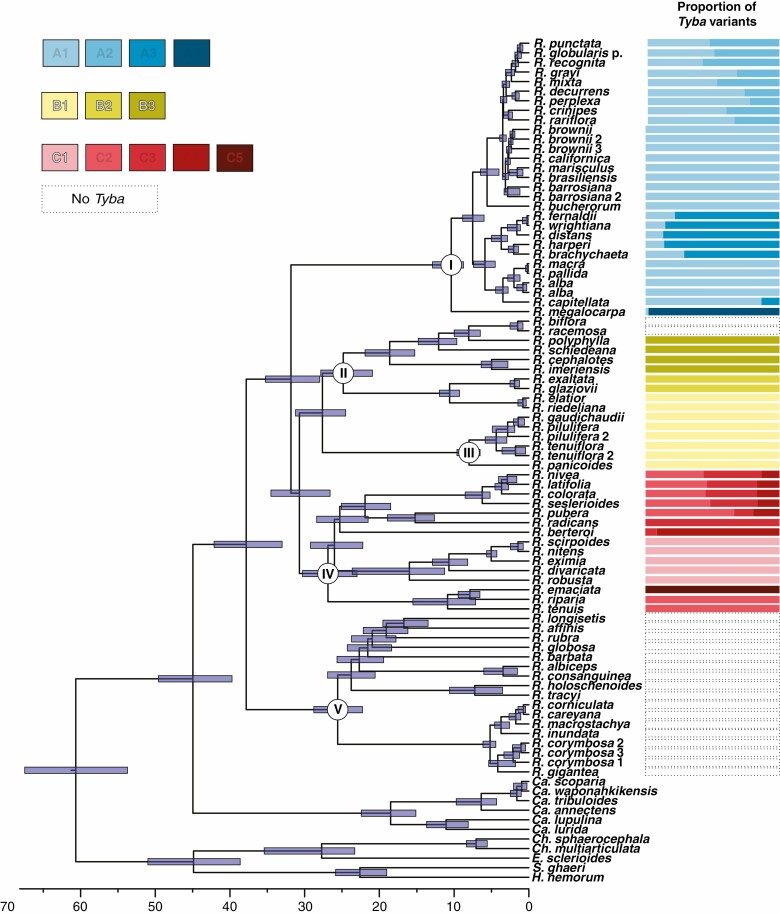
Fig. 2.
Phylogenetic relationships and molecular dating of Rhynchospora species. Coloured bars (according to the key at the top left of the figure) represent the proportion of different Tyba variants found in the genome of each species. Bars at the nodes of the tree represent the 95% confidence interval of the molecular dating analysis, with the axis scale representing divergence time (in millions of years). Circles with roman numerals in the nodes delimit the five clades discussed.

