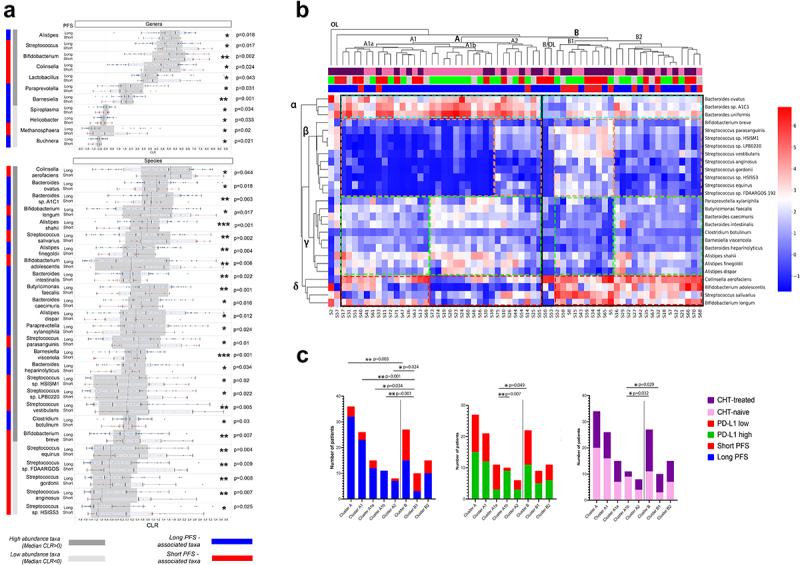
Figure 3.

Differentially abundant genera and species and outcomes. Cluster analyses. Horizontal bar charts show the abundance of key genera and species with significantly different abundance between patients with long- vs short PFS, Wilcoxon ranksum test, p < 0.05 (A). Only genera and species (Clr>-1) from the Bacteria and Archaea domains were included in the analyses. High abundance taxa (CLR≥0) and low abundance taxa (0 > CLR ≥ −1) are separately labeled. Heatmap displays Z-scores (blue=low, red=high) for every cell generated from individual CLR-transformed abundances from key species for all patients (B). Axis X shows patients (IDs) in the Discovery cohort, whereas indicator bars on top reflect their PFS (red/blue, short vs long), PD-L1 (green/red, high vs low) and front-line CHT-treatment (purple/pink, CHT-treated vs CHT-naive) as previously described (B). Axis Y shows key bacterial species clustered to representative groups (STable 7). There were two outlier patients (S2, S57), in the whole cohort and two outlier patients in cluster B (S50, S53), who cannot be clustered to any groups. Patient clusters are compared shown in stacked bar charts (C) according to their composition of long vs short PFS, PD-L1 high vs low and CHT-treated vs naive patients. Cluster a represents significantly more patients with long PFS (compared to cluster B, p = 0.003, C) with an increased abundance of beneficial α and γ bacteria, a decreased abundance of β and a decreased- or variable abundance of δ bacteria; cluster B is characterized by a decreased abundance of α and γ, an increased abundance of δ and an increased or variable abundance of β bacteria. Cluster A1a and A1b represent a PD-L1-low and high subcluster in cluster A, with no significant difference in patients according to PFS. Cluster A1b consists of significantly more CHT-naive patients than cluster B in general. Fisher’s exact test was used to calculate differences among all clusters and subclusters. Metric data are shown as mean and corresponding standard deviation (SD). Statistical significance *P < 0.05; **P < 0.01, ***P<.001.
