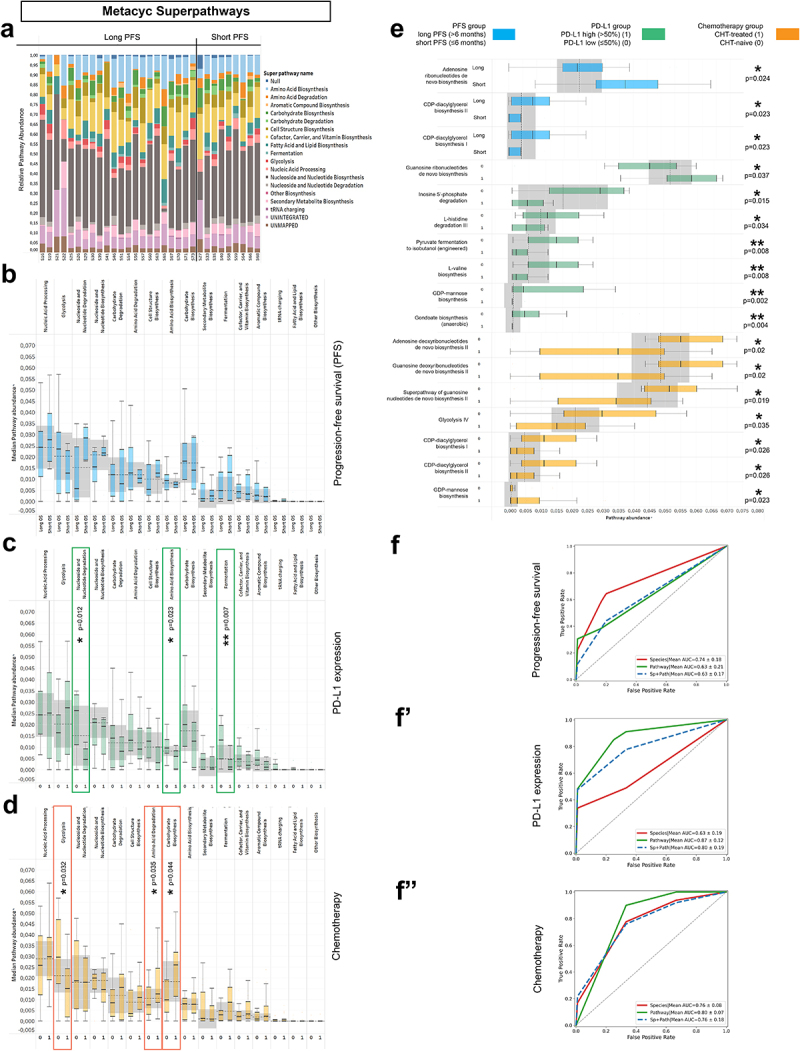
Figure 7.

Metagenome Pathways and machine learning approach. Abundance-distribution of Metacyc Superpathways per patient is shown in a stacked bar chart, where X axis shows patient IDs grouped according to PFS and Y axis represents the relative abundance of the correspondent Superpathway, color coded (A). Patients were grouped as long vs short PFS, PD-L1-high vs low and CHT-treated vs CHT-naive, as previously described. None of the superpathways showed significant difference according to PFS (B), whereas Nucleoside and Nucleotide degradation, Amino acid biosynthesis and Fermentation superpathways were significantly more abundant in PD-L1 low patients (compared to PD-L1 high patients, C). Regarding chemotherapy, chemo-naive (0) patients showed significantly increased abundance of the Glycolysis superpathway and significantly decreased abundance of the Amino acid degradation and Carbohydrate biosynthesis superpathways (compared to CHT-treated patients, D). Multiple individual Metacyc pathway are differentially abundant between different patient groups, including Adenosine Ribonucleotide de novo Biosynthesis (p = 0.024), CDP-diacylglycerol Biosynthesis I-II (p = 0.023) according to PFS (E); Guanosine Ribonucleotide de novo Biosynthesis (p = 0.037), Inosine 5’ Phosphate Degradation (p = 0.015) L-histidine Degradation III (p = 0.034), Pyruvate Fermentation to Isobutanol (p = 0.008), L-valine Biosynthesis (p = 0.008), GDP-mannose Biosynthesis (p = 0.002) and Anaerobic Gondoate Biosynthesis (p = 0.004) according to PD-L1 expression (E) and GDP-mannose Biosynthesis (p = 0.023), Adenosine- and Guanosine Deoxyribonucleotides de novo Biosynthesis II (p = 0.02, respectively), Superpathway of Guanosine Nucleotides de novo Biosynthesis II (p = 0.019), Glycolysis IV (p = 0.035) and CDP-diacylglycerol Biosynthesis I-II (p = 0.026, respectively) according to Chemotherapy-regime (E). 5-fold cross validation performed on Random Forest (RF) machine learning models show that PFS is best predicted with key species (AUC: 0.74; Recall: 0.64; F1: 0.56, F) and PD-L1 expression is best predicted with pathways (AUC: 0.88; Recall: 0.87; F1: 0.82, F’). The model fitted fairly to the prediction of first-line (CHT-treated) or subsequent-line (CHT-treated) IT for both key species (AUC: 0.76; Recall: 0.86; F1: 0.82, F”) and pathways (AUC: 0.8; Recall: 1; F1: 0.88, F”). Metric data are shown as mean and corresponding standard deviation (SD). Statistical significance *P < 0.05; **P < 0.01, ***P<.001.
