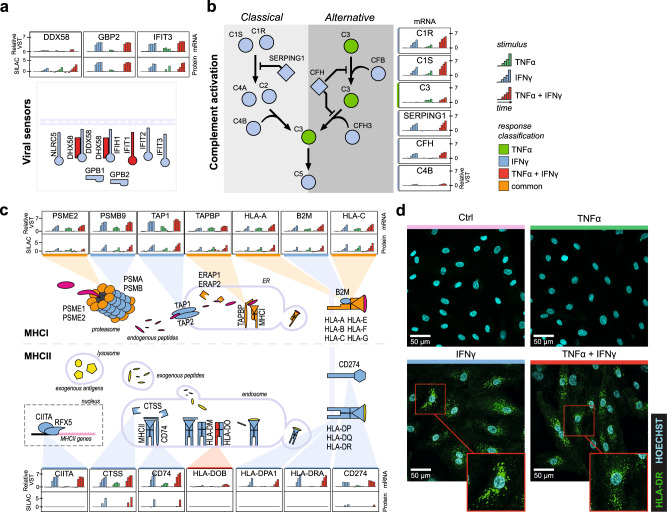
Fig. 6. IFNγ induces regulation of viral sensors, complement factors and antigen presentation in ECs.
a Overview of regulated innate immune sensors in the “Viral Sensors” hub, b the “Complement factors” hub and c the “Antigen presentation” hub. Bar plots of highlighted transcripts/proteins indicate median transcript level (VST) or protein SILAC ratio per stimulus and timepoint (n = 3 biological replicates). Colors indicate stimulus: TNFα (green), IFNγ (blue), TNFα + IFNγ (red). Node fill indicates response classification of transcript: TNFα (green), IFNγ (blue), TNFα + IFNγ (red), common (orange) and no classification (gray). d Confocal images of HLA-DR immunostaining in unstimulated ECs (Ctrl, pink) and stimulated with TNFα, IFNγ, and TNFα + IFNγ. HLA-DR staining is depicted in green, Hoechst staining in cyan. Representative experiment shown (n = 3 biologically independent experiments). Upper limit of the display range were adjusted equally across images for visualization purposes.

