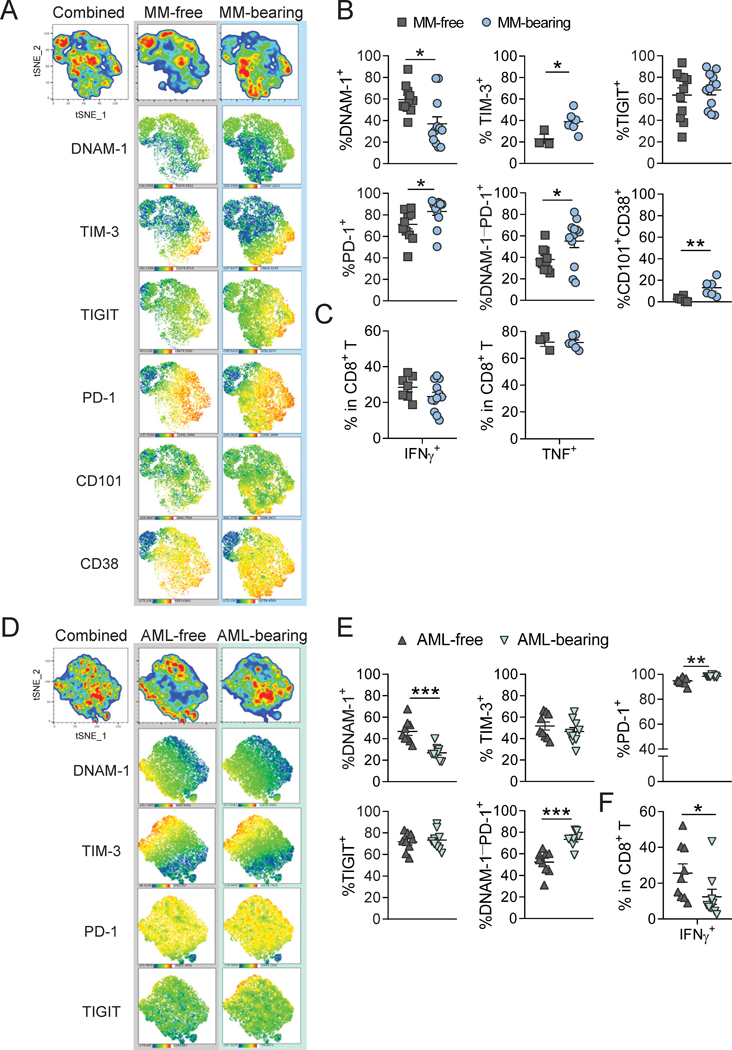
Figure 3: CD8+ T cell exhaustion was primarily driven by alloantigen and not tumor antigen after alloBMT.
B6 recipients were transplanted with 5 × 10⁶ BM with 0.5 × 10⁶ CD4+ + 0.5 × 10⁶ CD8+ T cells from C3H.SW (alloBMT) donors. (A-C) Myeloma-bearing (MM-bearing) or naïve (MM-free) recipients were sacrificed at 8 weeks post-transplant and BM was harvested to assess CD8+ T cell phenotype. (A) representative t-SNE analysis of PD-1, TIGIT, TIM-3, DNAM-1, CD101 and CD38 expression and (B) frequency of DNAM-1+, TIM-3+, TIGIT+, PD-1+, DNAM-1−PD-1+ and CD101+CD38+ cells within CD8+ T cells. (C) Frequency of IFNγ and TNF-expressing cells within CD8+ T cells after PMA/ionomycin re-stimulation. (n = 11–12/group from 2 experiments; TNF and TIM-3 n = 3–6/group from 1 experiment). (D-F) MLL-AF9-bearing (AML-bearing) or naïve (AML-free) mice were sacrificed 4 weeks post-transplant and BM was harvested to assess CD8+ T cell phenotype. (D) t-SNE analysis of PD-1, TIGIT, TIM-3 and DNAM-1 expression and (E) frequency of DNAM-1+, TIM-3+, PD-1+, TIGIT+ and DNAM-1−PD-1+ cells within CD8+ T cells. (F) Frequency of IFNγ-expressing cells within CD8+ T cells after PMA/ionomycin re-stimulation. (n = 9/group from 2 experiments). Data represent mean ± SEM. Mann-Whitney U test or Student’s t-test were used for numerical values. * p<0.05, ** p<0.01, *** p<0.001.

