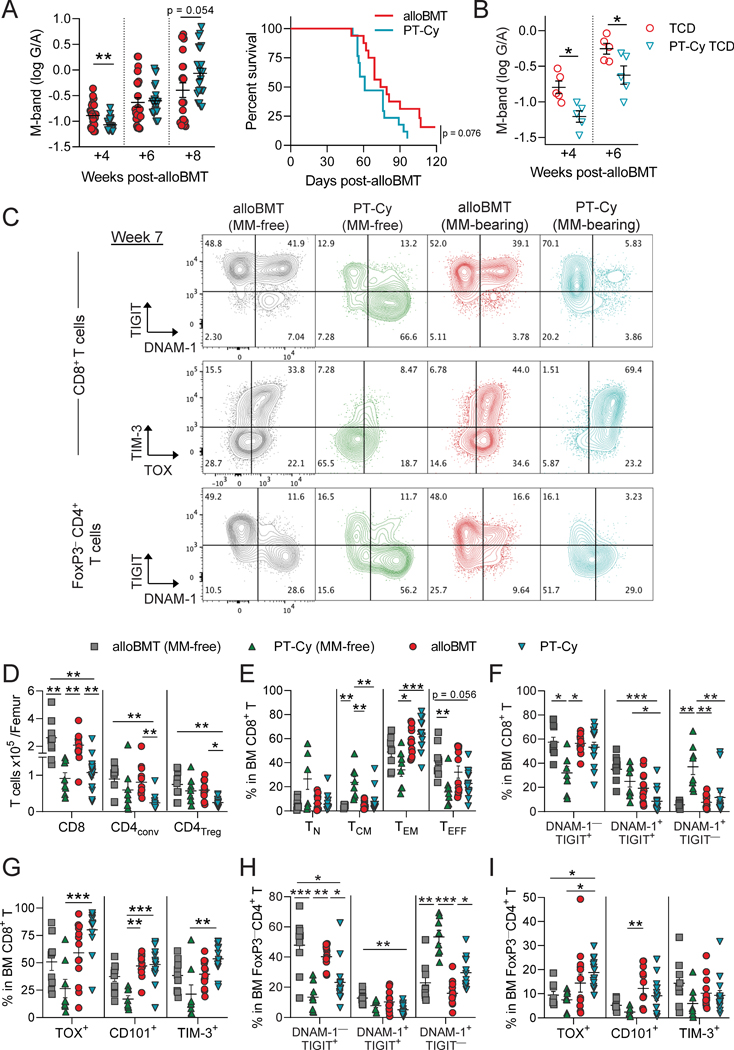
Figure 5: PT-Cy enabled the generation of myeloma-driven CD8+ T cell exhaustion.
B6 MM-bearing recipients were transplanted with 5 × 10⁶ BM with 0.5 × 10⁶ CD8+ and 0.5 × 10⁶ CD4+ T cells from C3H.SW donors. (A) MM-bearing recipients of T cell replete grafts were untreated (alloBMT) or administered 50 mg/kg cyclophosphamide on D+3 and D+4 (PT-Cy) and monitored for myeloma burden using M-band (log G/A; n = 24 from 4 experiments; Mann-Whitney U test) and survival (n = 17 from 3 experiments; Log-rank test). (B) MM-bearing recipients of T cell deplete BM grafts (TCD) were treated as above and monitored for M-band (n = 5 from 1 experiment; Student’s t-test). (C-I) MM-bearing and MM-naive recipients were treated as above and BM was harvested at 7 weeks post-transplant for immunophenotyping using flow cytometry (n = 8 – 14 from 2 experiments). (C) Representative contour plots. (D) CD8+, conventional CD4+ (FoxP3−), and regulatory CD4+ T cell enumeration per femur. (E) Frequency of naïve T (TN; CD44−CD62L−), central memory T (TCM; CD44+CD62L+), effector memory T (TEM; CD44+CD62L−), and effector T (TEFF; CD44−CD62L−), (F) DNAM-1 and TIGIT expressing cells, and (G) TOX+, CD101+ and TIM-3+ cells within CD8+ T cells. (H) Frequency of DNAM-1 and TIGIT expressing cells and (I) TOX+, CD101+ and TIM-3+ cells within conventional CD4+ T cells. Data represent mean ± SEM. One-way ANOVA with Tukey’s multiple comparisons test or Kruskal-Wallis test with Dunn’s multiple comparisons test. * p < 0.05 ** p < 0.01 *** p <0.001

