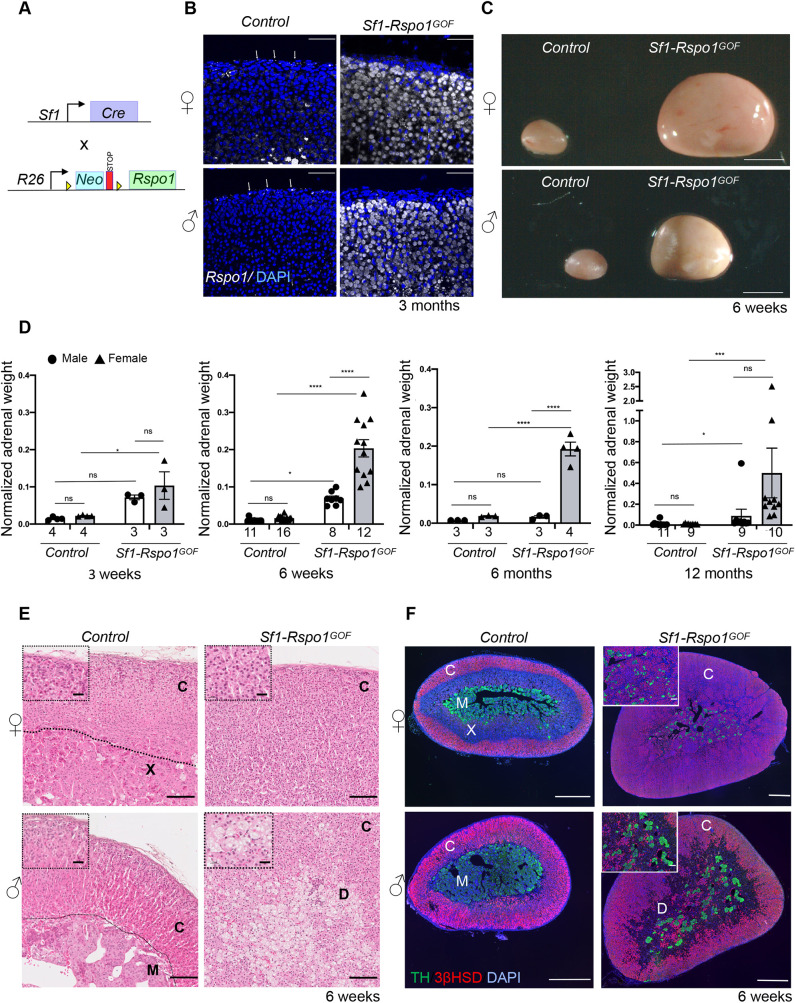
Fig. 1.
RSPO1 overexpression leads to sex-specific adrenocortical hyperplasia or degeneration. (A) Schematic representation of the genetic strategy to overexpress RSPO1 in steroidogenic cells using Sf1-Cre. (B) In situ hybridization for Rspo1 using RNA Scope technology on adrenal sections from 3-month-old mice. White arrows mark Rspo1 mRNA molecules. Scale bars: 50 μm. (C) Representative photographs of adrenal glands from control and Sf1-Rspo1GOF mice at the end of puberty (6 weeks of age). Scale bars: 1 mm. (D) Graphs of mean adrenal weight normalized to body weight at different ages comparing control mice to Sf1-Rspo1GOF mice when ectopic RSPO1 expression is driven by Sf1-Cre (error bars represent s.e.m.). The numbers below the graph columns represent number of samples in each group (n). Statistical analysis for 3 weeks, 6 weeks and 6 months was performed using ordinary two-way ANOVA followed by Tukey's multiple comparisons test. Statistical analysis for 12 months was done using a non-parametric test (Kruskal–Wallis test) owing to the non-Gaussian distribution of the data. Adjusted P-values for comparisons at 3 weeks: control females (F) versus Sf1-Rspo1GOF F, P=0.0192; control males (M) versus Sf1-Rspo1GOF M, P=0.1067; Sf1-Rspo1GOF F versus Sf1-Rspo1GOF M, P=0.5631. Adjusted P-values for comparisons at 6 weeks: control F versus Sf1-Rspo1GOF F, P<0.0001; control F versus control M, P=0.0239; Sf1-Rspo1GOF F versus Sf1-Rspo1GOF M, P<0.0001; control M versus Sf1-Rspo1GOF M, P=0.0184. Adjusted P-values for comparisons at 6 months: control F versus Sf1-Rspo1GOF F, P<0.0001; control M versus Sf1-Rspo1GOF M, P=0.9500; Sf1-Rspo1GOF F versus Sf1-Rspo1GOF M, P<0.0001. Adjusted P-values for comparisons at 12 months: control F versus Sf1-Rspo1GOF F, P=0.0008; control M versus Sf1-Rspo1GOF M, P=0.0144; Sf1-Rspo1GOF F versus Sf1-Rspo1GOF M, P=0.4853. ns, not significant; *P<0.05; ***P<0.001; ****P<0.0001. (E) H&E staining of adrenals from 6-week-old mice. Scale bars: 100 μm (for insets, 20 μm). (F) Immunofluorescence staining for tyrosine hydroxylase (TH, marker of the adrenal medulla) and 3βHSD (marker of steroidogenic cells), using adrenal sections from 6-week-old mice. Note that the size of the scale bar is different for each picture. Scale bar: 500 μm (for insets, 100 μm). C, cortex; X, X-zone; M, medulla; D, degeneration.

