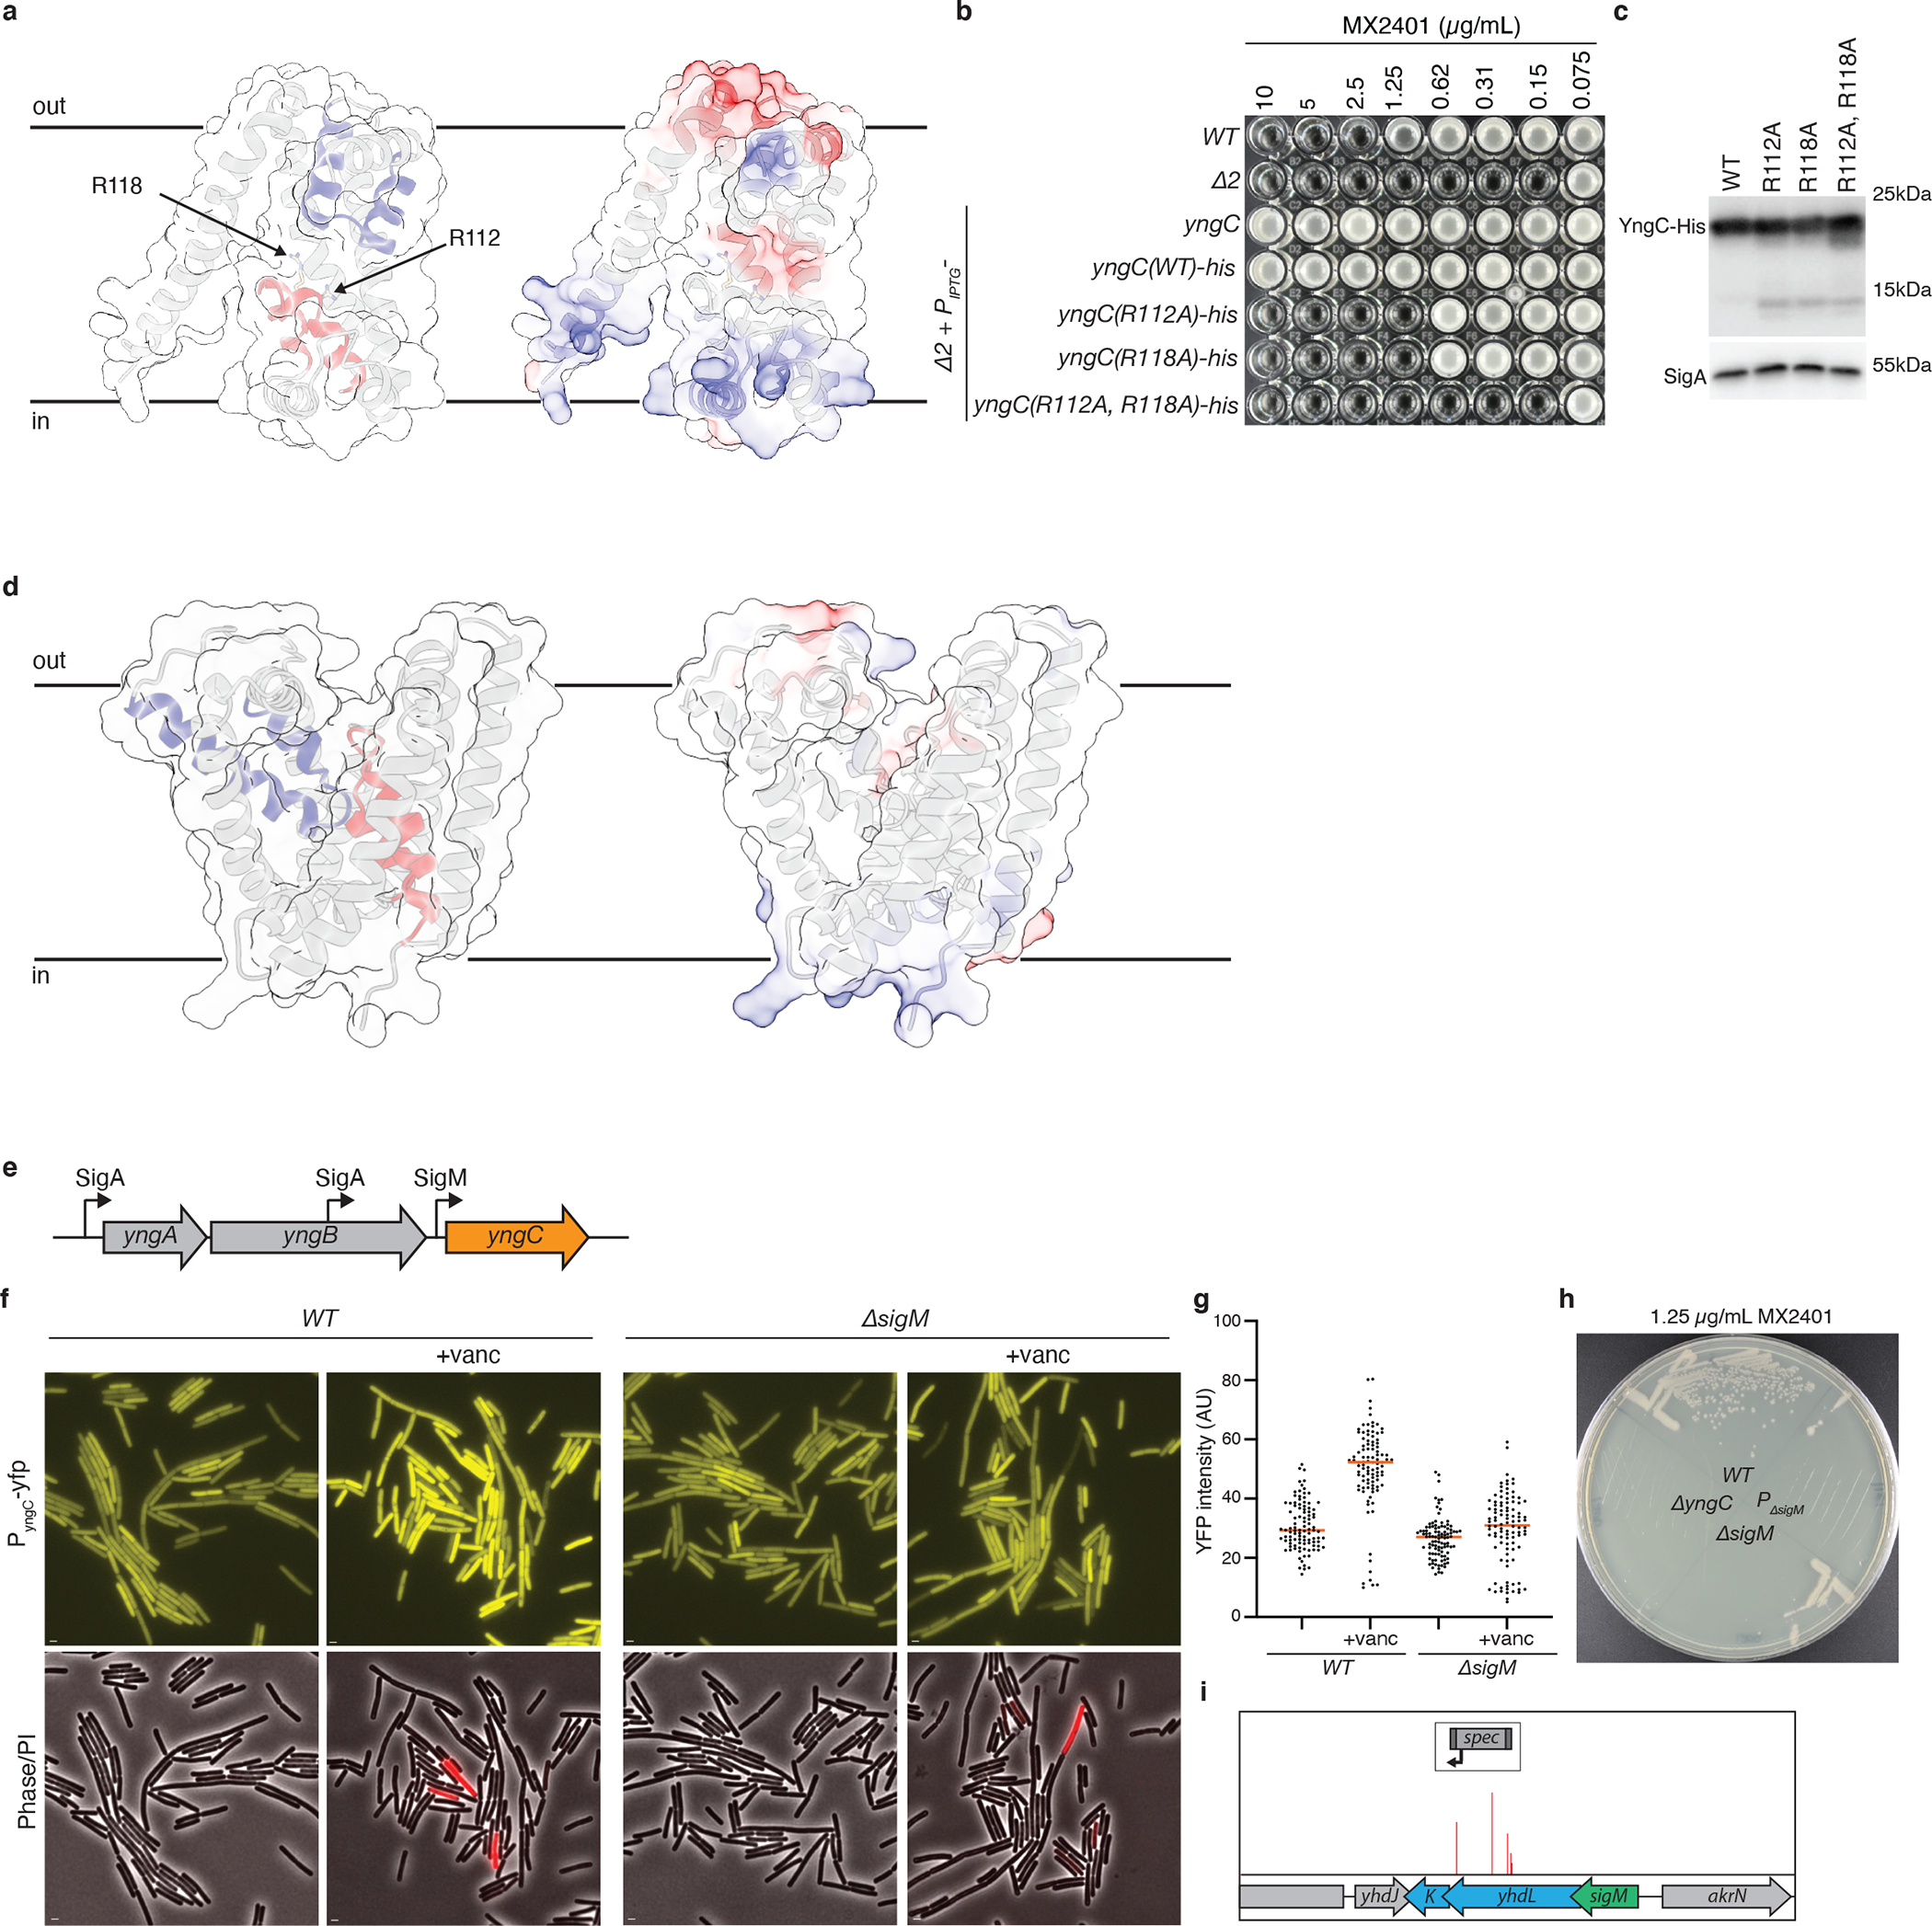
Extended Data Fig. 2. YngC has features of membrane transporters and is expressed under σM control.

Structural models of YngC (a) and SAOUHSC_00846 (d) as predicted by AlphaFold2. (Left) Membrane re-entrant helices are highlighted in red and blue. Conserved arginines in the red re-entrant helix of YngC are indicated. (Right) Surface charge distribution in the predicted structures. (b) Minimum inhibitory concentration (MIC) assays of the indicated B. subtilis strains with point mutations in the conserved arginines in yngC. (c) Immunoblot analysis of YngC-His levels using anti-His antibodies of the strains in (b). SigA is the sample processing control. (e) Schematic of the yngABC operon highlighting the promoters that regulate yngC expression. Two are recognized by sigma factor A (σA) and one is recognized by the ECF sigma factor M (σM). (f) Representative fluorescence images of cells harboring a transcriptional fusion of the yngC σM promoter to yfp. YFP fluorescence increases in cells exposed to vancomycin for 30 minutes, a condition that activates σM. The reporter is not induced by vancomycin in a ΔsigM mutant. Scale bar, 1 μm. (g) Quantification of YFP fluorescence from 100 cells of the strains and conditions in (f). Bar represents the median. (h) Streaks of the indicated strains on LB agar supplemented with 1.25 μg/mL MX2401. PΔsigM contains a deletion of the σM promoter of yngC. (i) The Tn-seq screen for MX2401 resistance mutants identified insertions in the genes (yhdL and yhdK) encoding the anti-σM factors, consistent with increased σM-dependent transcription of yngC providing MX2401 resistance. Transposon insertion profile at the indicated B. subtilis genomic region is shown. Each vertical line indicates an insertion site; its height reflects the number of reads at this position (maximum height ≥5,000). The transposon insertion site with the maximum number of reads in this region had 2,600 reads. For comparison, the insertion sites adjacent to yngC had >20,000 reads.
