Figure 1.
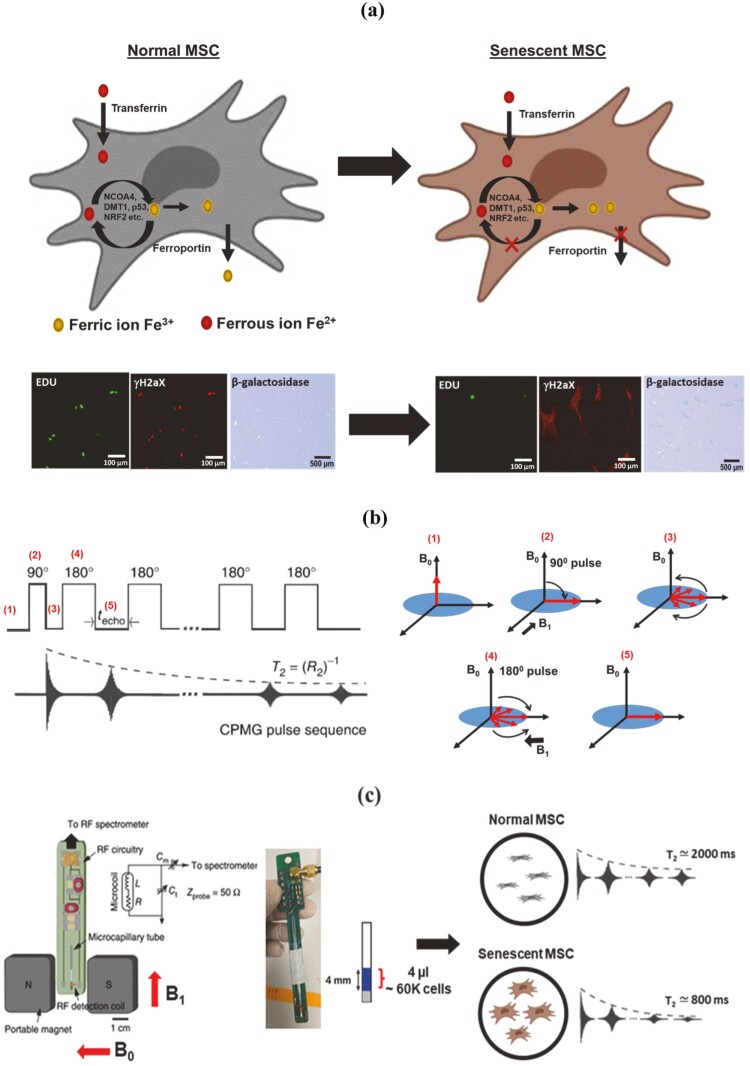
Live-cell and rapid detection of senescent MSCs using magnetic resonance relaxometry. (a) Normal cells maintain iron homeostasis, mediated by numerous iron transporters and iron-binding proteins. Senescent cells are correlated with the accumulation of paramagnetic Fe3+ (an inactive form of iron). Normal cells and senescent cells analyzed by standard assays are shown in the below images. The cells are stained by the senescence marker (γ-H2aX foci, red fluorescence), the proliferation marker, 5-ethynyl-2ʹ-deoxyuridine (Edu, green fluorescence), and β-galactosidase staining (blue fluorescence). (b) The CPMG (Carr-Purcell-Meiboom-Gill) pulse sequence for measuring the T2 values, which works efficiently in inhomogeneous magnetic fields produced by the permanent magnet of µMRR. A train of radiofrequency pulses is applied to the proton nuclei at the resonance frequency of 21.65 MHz with the inter echo time interval techo. It is repeated for thousands of echoes until an equilibrium is reached. This decaying peak height of successive echoes over time is called transverse relaxation time T2. (c) MRR system consists of a permanent magnet that provides a strong magnetic field (B0). A home-built radiofrequency (RF) detection probe is connected to an RF spectrometer. The MSC sample (young/proliferating/senescent MSCs) in the microcapillary tube is placed in the RF detection coil for T2 measurements. The microcapillary tube contains the 4 µL of MSC sample (blue) in the 4 mm detection range of the RF detection coil. The typical cell number required is 60 000 MSCs within the detection volume. The grey color is the crystoseal to seal the microcapillary tube. The right side shows the 1H spin-spin relaxation time T2 of normal and senescent MSCs, demonstrating decreased T2 in senescent MSCs compared to normal MSCs. Mesenchymal stem cell figures are adapted from the icon library of “Cell Types” by BioRender.com.

