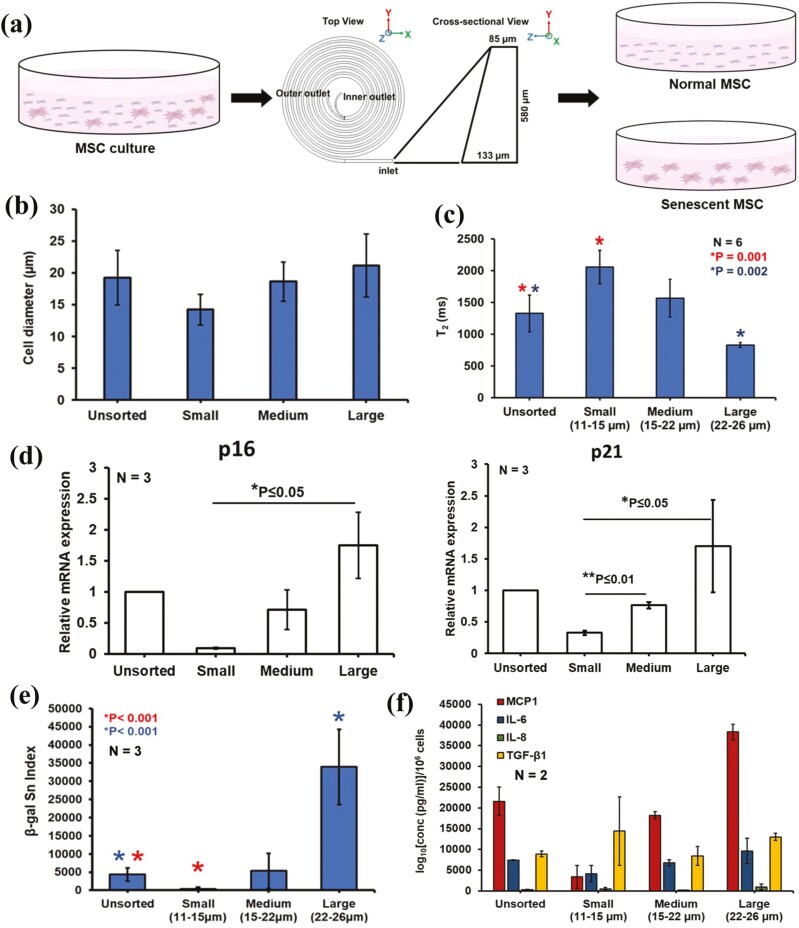
Figure 4.
MRR assay shows large MSCs are more senescent based on size sorting using a spiral microfluidic device. (a) Size separation of young/proliferating and senescent MSCs using a spiral microfluidic device from MSC cultures. The MSC culture is pumped into the microfluidic device and sorted at various speeds to collect different-sized MSCs at the outlets. Mesenchymal stem cell figures are adapted from the icon library of “Cell Types” by BioRender.com. (b) Cell diameter (µm) of sorted MSCs using spiral microfluidic sorting device. (c) Average T2 values (n = 6) of unsorted and size-sorted MSCs from 2 different donors (D3 and D4 passage 3) using a spiral microfluidic device. Large cells (22-26 µm) are the size-sorted MSCs collected in the first round of sorting, and medium (15-22 µm) and small (11-15 µm) cells are collected from the 2nd round of sorting. Statistical analysis of unsorted and small cells (n = 6, *P = .001) and unsorted & large cells (n = 6, *P = .002) are done by unpaired 2-tailed t-test. (d) The mRNA expression level of unsorted and size-sorted MSCs showing the overexpression of senescent markers P16 and P21 in LargeMSCs. The data shown are representative of 3 technical replicates for each group. An unpaired 2-tailed t-test was performed between selected pairs to determine the statistical significance. *Represents P ≤ .05, **Represents P ≤ 0.01. (e) Quantification of senescence index from the β-galactosidase images of unsorted and size-sorted MSCs. Five to 10 random areas were captured at the bright field by a color camera for quantifying the β-galactosidase staining-based senescence index (β-gal Sn index) using MATLAB image processing. Biological replicates N = 3. The images of each sample contain more than 500 cells. (f) Secretome profiling of factors associated with senescence, secreted from unsorted and size-sorted MSC subpopulations in 2 donors. Each sample was performed in technical duplicates. Concentrations of the secreted analytes normalized per million cells were plotted.

