
Figure 2.
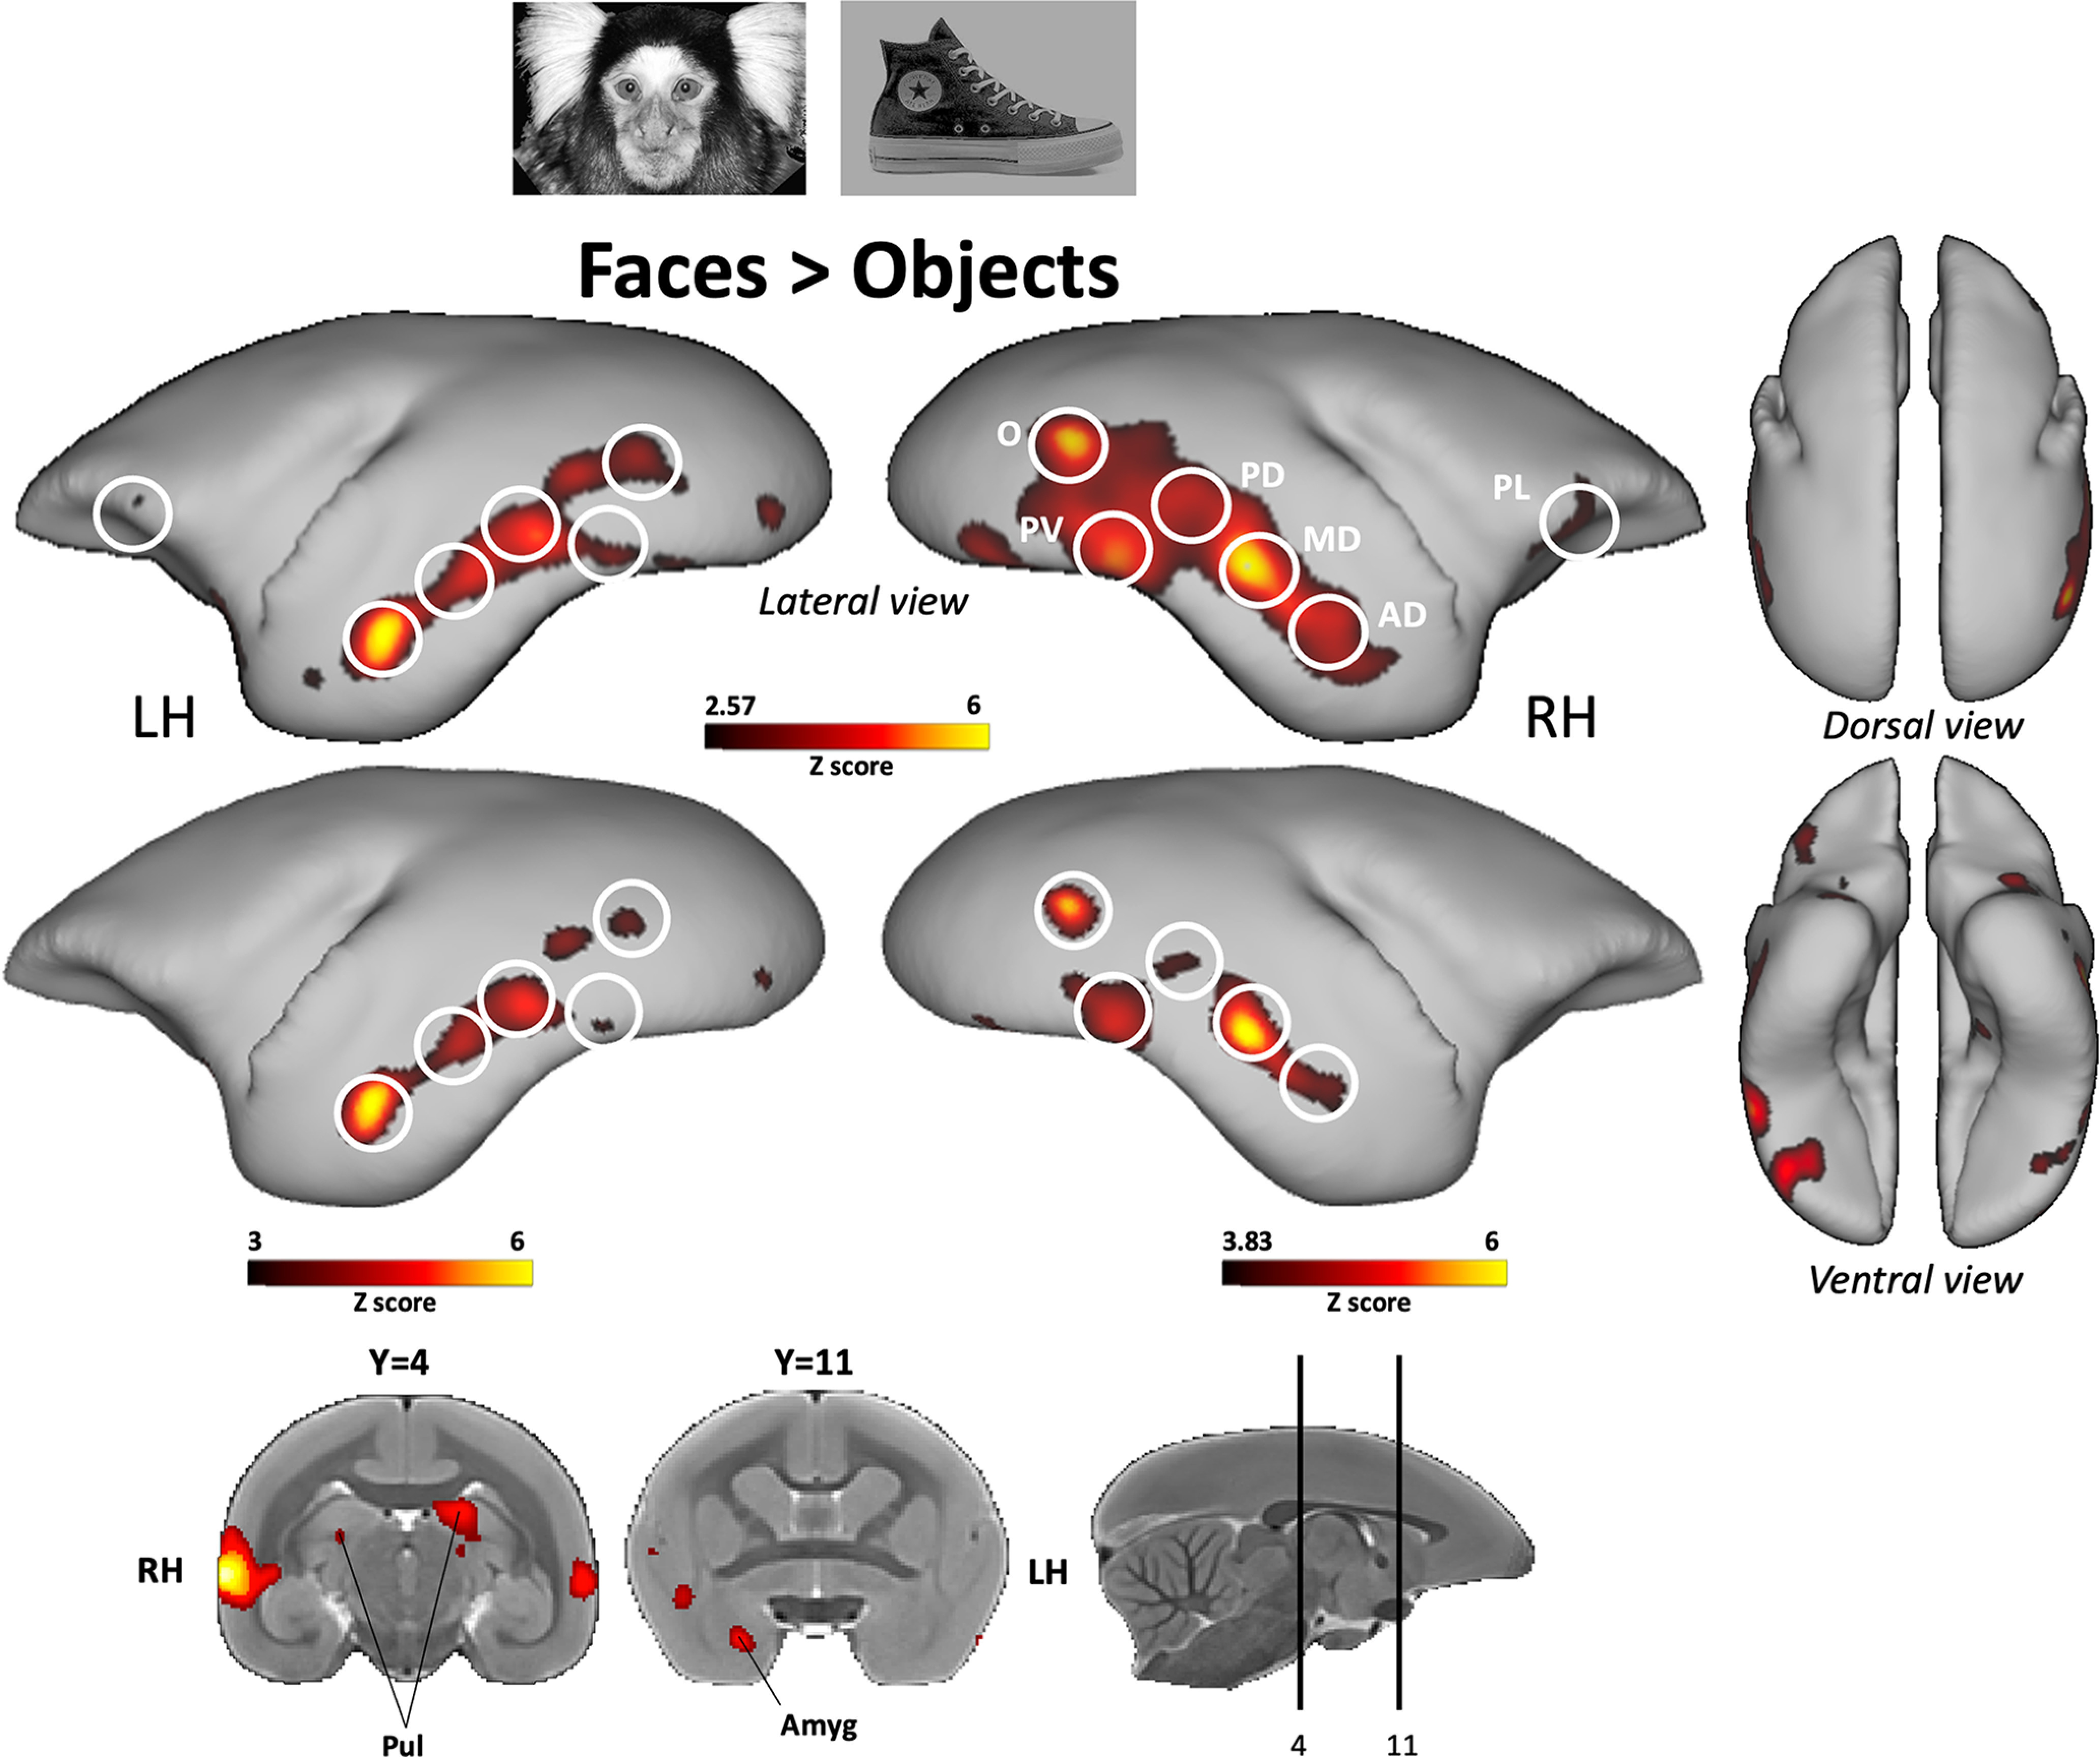
Face patches identified by comparing faces with objects. Group functional maps depicting significantly higher activations for faces compared with objects obtained from 7 awake marmosets. The maps reveal six functional patches, displayed on lateral, dorsal, and ventral views of left and right fiducial marmoset cortical surfaces. No activations were found on medial view. The white circles delineate the peak of activation of the following face patches using the labeling described in the study by Hung et al. (2015): occipitotemporal face patches O (V2/V3), PV (V4/TEO), PD (V4t/FST), MD (posterior TE), and AD (anterior TE). The frontal face patch that we called PL patch (areas 45/47) has only previously been identified when faces were compared with scrambled faces (Schaeffer et al., 2020). Subcortical activations are illustrated on coronal slices. In the top map, brain areas reported have an activation threshold corresponding to z scores > 2.57 (p < 0.01, AFNI 3dttest++). In the bottom map, we increased the activation threshold to isolate face patch subregions and to delineate the highest z value (i.e., peak of activation) of each face patch, which allowed us to determine the ROIs for the face patches (z scores > 3 for the left hemisphere; z scores > 3.83 for the right hemisphere).