
Figure 4.
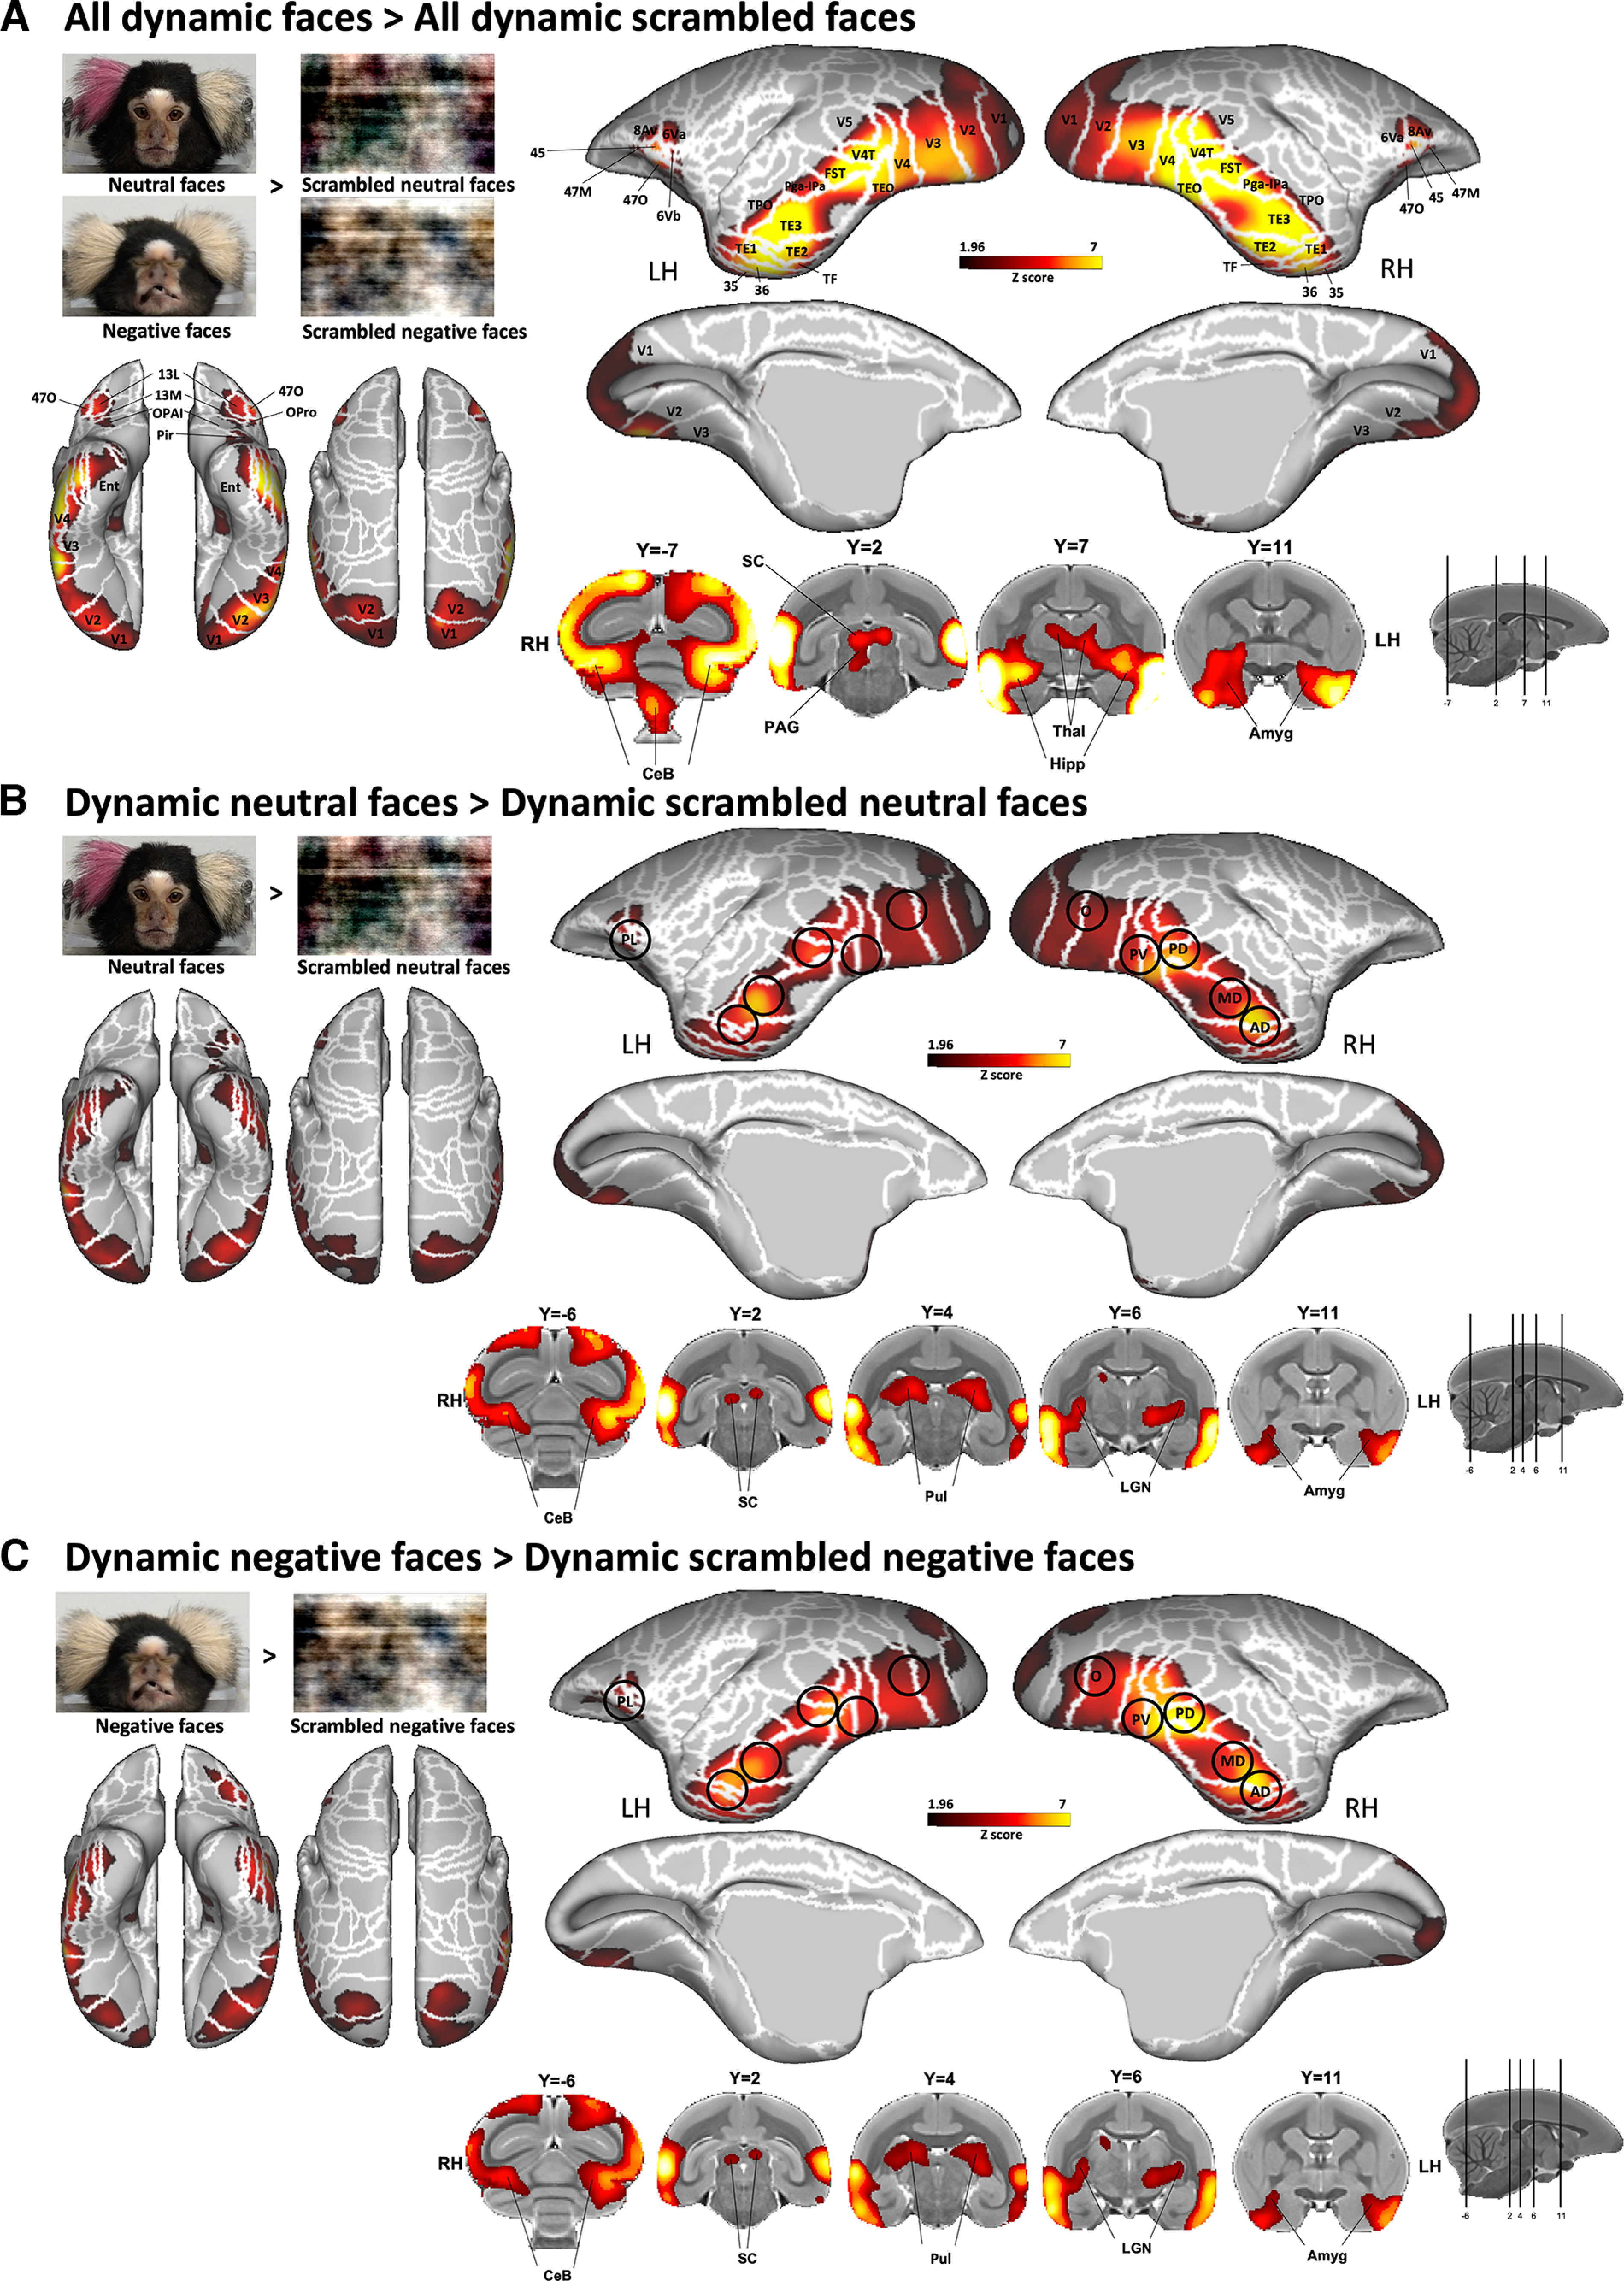
Brain networks involved in dynamic facial expression processing. A–C, Group functional maps showing significantly greater activations for the comparison between the following: A, All emotional faces (i.e., neutral and negative faces) and all scrambled emotional faces (i.e., scrambled versions of neutral and negative faces); B, neutral facial expression and its scrambled version; and C, negative facial expression and its scrambled version. Group functional topology comparisons are displayed on the left and right fiducial marmoset cortical surfaces (lateral, medial, dorsal, and ventral views) as well as on coronal slices, to illustrate the activations in subcortical areas. The white line delineates the regions based on the Paxinos parcellation of the NIH marmoset brain atlas (Liu et al., 2018). The black circles delineate the position of face patches identified by the face-localizer task depicted in Figure 2. The brain areas reported have activation threshold corresponding to z scores > 1.96 (p < 0.05, AFNI's 3dttest++; cluster-size correction, α = 0.05 from 10,000 Monte-Carlo simulations).