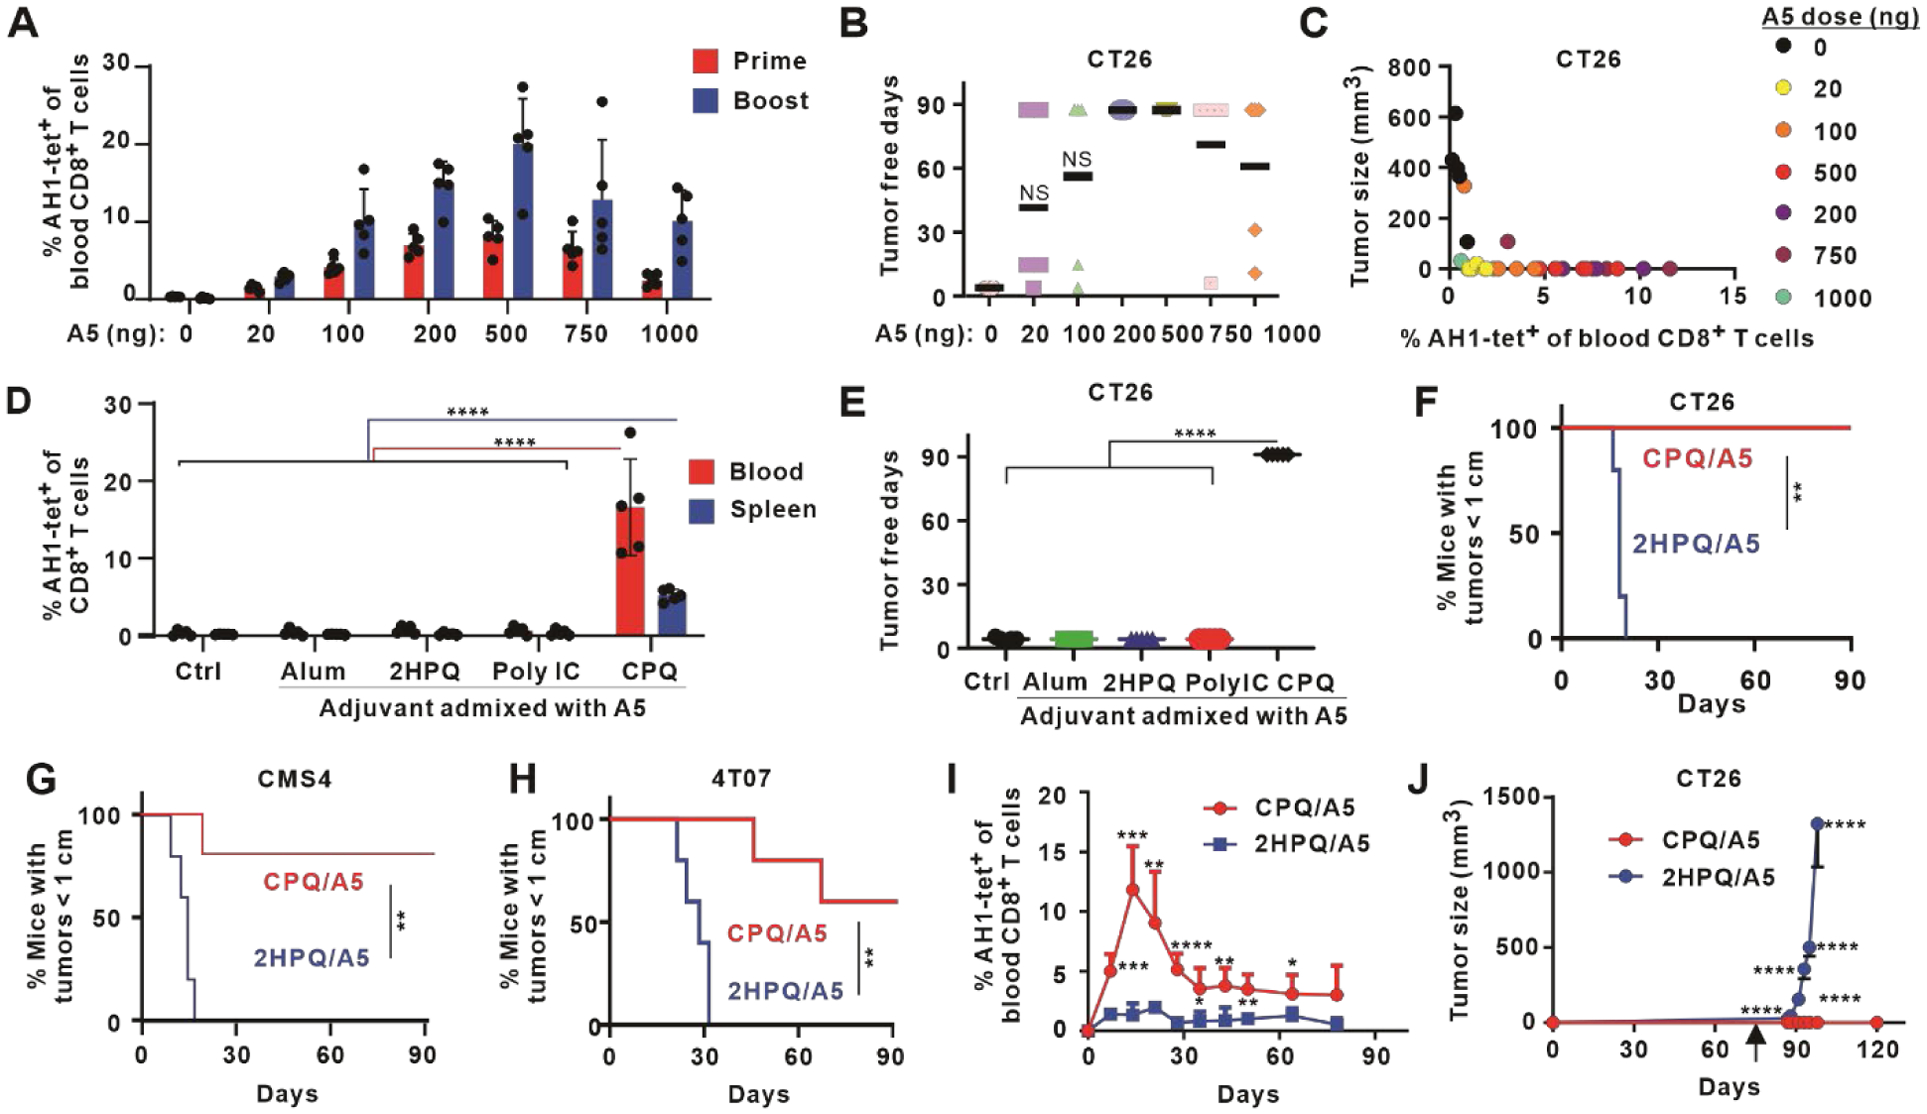
Figure 3. Durable and robust protection from diverse tumor model challenges with CPQ/A5 immunization.

Mice were immunized on days 0 and 7 with the indicated vaccine dose, blood were collected on days 7 and 13, and tumor cells were inoculated on day14. A) Percentage of AH1-tet+ cells in the CD8+ T cell population in blood. B) Tumor-free days following CT26 challenge. The study duration was 90 days. C) Correlation of Ag-specific CD8+ T cells and tumor sizes 2 weeks after tumor inoculation. D) Percentage of AH1-tet+ cells in the CD8+ T cell population in the blood and spleen on day 13, and E) tumor-free days after challenge with CT26 cells, for mice immunized with 500 ng A5 admixed with the indicated adjuvant. F) Percentage of mice with tumor sizes smaller than 1 cm after immunization with 500 ng A5 peptide admixed with CPQ or 2HPQ liposomes and challenged subcutaneously with CT26 (F) or CMS4 (G) cells, or orthotopically with 4T07 (H) cells. I) Kinetics of AH1-tet+ CD8+ T cells in the the blood of mice vaccinated with 500 ng A5 peptide admixed with CPQ or 2HPQ on day 0 and 7 J) Tumor growth of mice challenged with CT26 cells subcutaneously on day 80 (indicated by arrow). Bars show mean for n=5 mice per group, and std dev. where indicated. * p < 0.05, ** p < 0.01, *** p < 0.001, and **** p < 0.0001, analyzed by one-way ANOVA with Bonferroni’s post hoc test (D, E), log rank test (F, G, H), or two-tailed unpaired Student’s t-test (I, J). Asterisks in I and J indicate statistically significant differences between CPQ/A5 and 2HPQ/A5 at the same time point.
