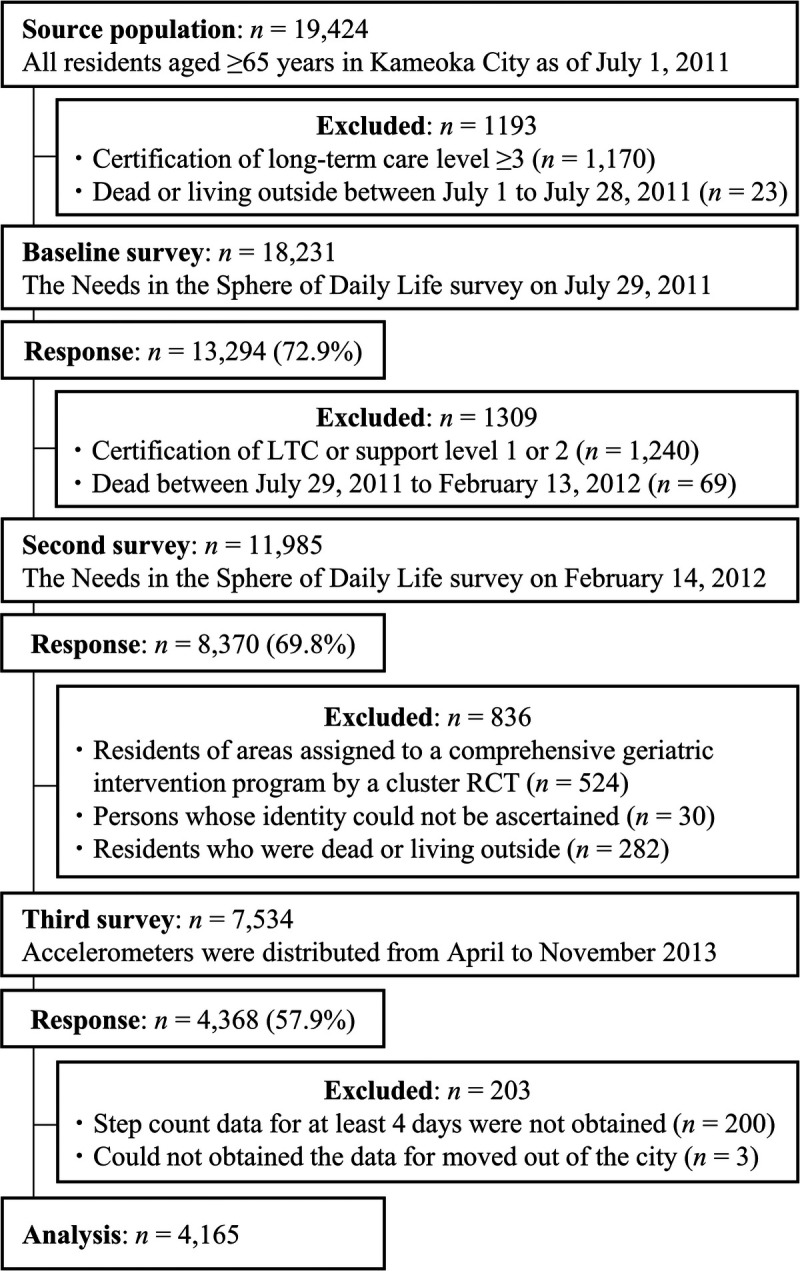
FIGURE 1.

Participant flow diagram for the analysis of daily step counts and mortality in the Kyoto–Kameoka study. RCT, randomized controlled trial, LTC, long-term care.

Participant flow diagram for the analysis of daily step counts and mortality in the Kyoto–Kameoka study. RCT, randomized controlled trial, LTC, long-term care.