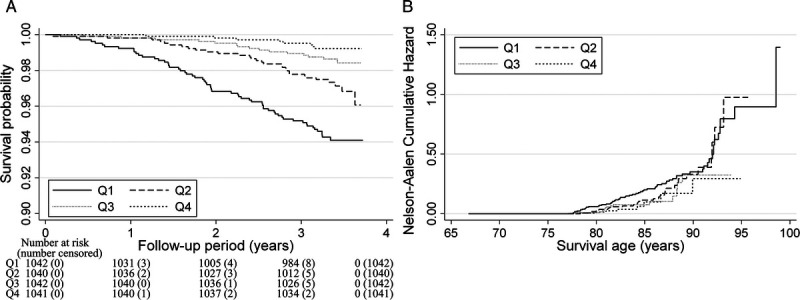
FIGURE 2.

Survival analysis for all-cause mortality according to daily step counts among older adults. A, Multivariable-adjusted Kaplan–Meier survival curves using inverse probability weighting according to quartiles (Qs) of daily step counts. B, Nelson–Aalen cumulative hazard curves using age as the time scale. The adjustment factors were age, sex, population density, season of wear, body mass index, smoking status, alcohol consumption status, family structure, educational attainment, economic status, denture use, medication use, number of chronic diseases, and frailty status.
