FIGURE 2.

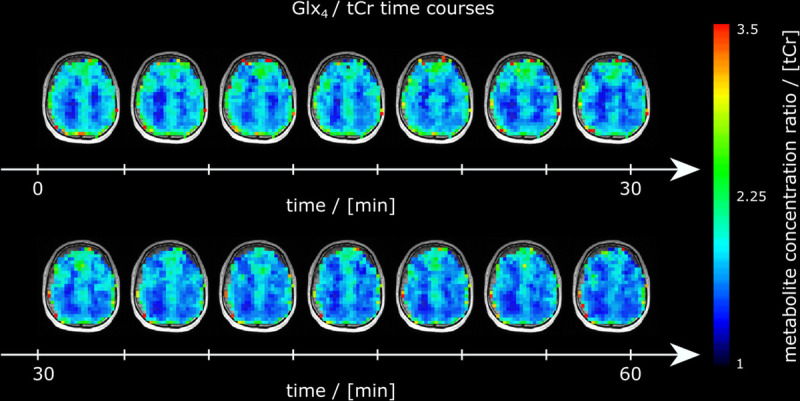
Time courses of axial Glx ratio maps referenced to tCr (Glx4/tCr) maps from 1 representative subject over the entire measurement visualizing the image intensity decrease over time due to deuterium labeling.

Time courses of axial Glx ratio maps referenced to tCr (Glx4/tCr) maps from 1 representative subject over the entire measurement visualizing the image intensity decrease over time due to deuterium labeling.