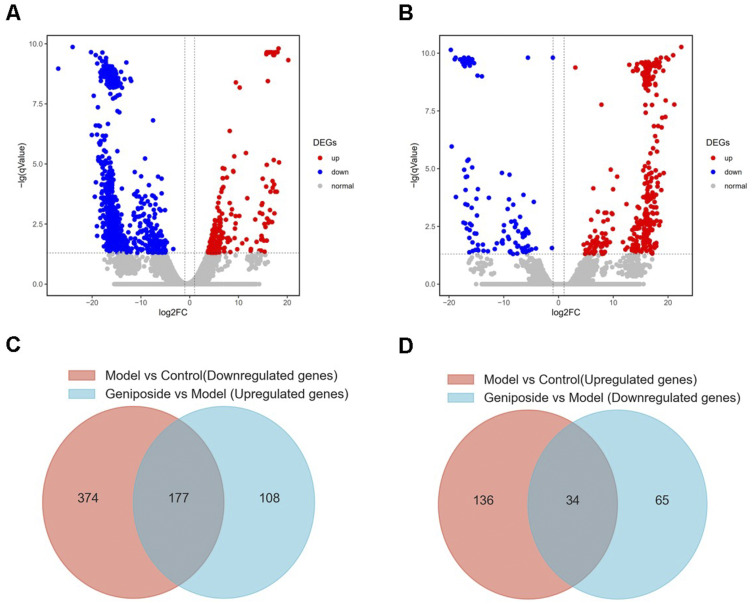
Figure 1.
Identification of differentially expressed genes (DEGs). (A) Volcano plot of the Model group compared with the Control group (Model vs Control). (B) Volcano plot of the Geniposide group compared with the Model group (Geniposide vs Model). Red and blue dots indicate upregulated and downregulated genes, respectively. (C) Venn diagram of overlapping DEGs in Model vs Control (downregulated genes) and Geniposide vs Model (upregulated genes). (D) Venn diagram of overlapping DEGs in Model vs Control (upregulated genes) and Geniposide vs Model (downregulated genes).

