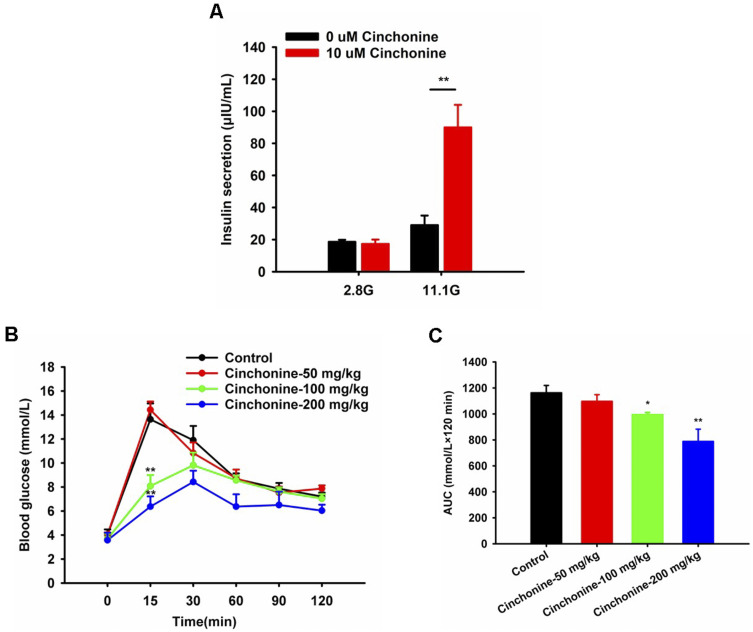
Figure 3.
Insulinotropic and glucose-lowering effects of cinchonine. (A) Treatment of islets with cinchonine (10 μM) under 2.8 mM or 11.1 mM glucose (n=7). (B) Oral glucose tolerance test (OGTT) was performed on C57BL/6 mice, and the area under the curve (AUC) was calculated (C) (n=3). All experimental results are expressed as mean ± SEM. Statistical differences in insulin secretion and blood glucose were obtained via one-way ANOVA or Student’s t-test. Statistical differences in AUCs were evaluated using the Mann–Whitney Rank Sum test. *p<0.05, **p<0.01.

