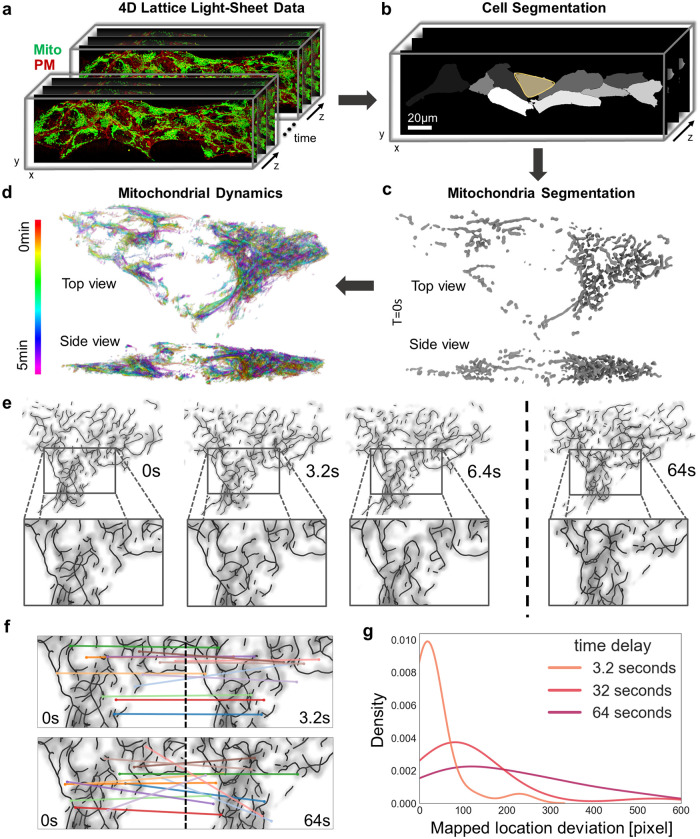
Fig 1. Mitochondrial network topology is preserved in high-framerate 4D fluorescence microscopy data.
a, Representative 4D (3D+time) lattice light-sheet microscopy data of a hiPSC colony labeled with MitoTracker (mitochondria, green) and expressing CAAX-RFP (plasma membrane, red). b, Individual cells in the colony are segmented based on the plasma membrane marker. c, Mitochondria fluorescence signal in a single cell is segmented using MitoGraph. d, Mitochondrial network skeleton dynamics over 5 min every 6.4s (time red to purple). e, Mitochondrial fluorescence density and segmented network skeleton are overlaid and shown for frame numbers 0, 1, 2, 20 at frame interval 3.2s. f, Scale-invariant feature transform (SIFT) maps image features for two frames separated by 3.2s (top), and 64s (bottom). The image size for the mapped region is 1034px by 642px. g, Pixel deviation between SIFT-mapped feature locations at different time intervals.

