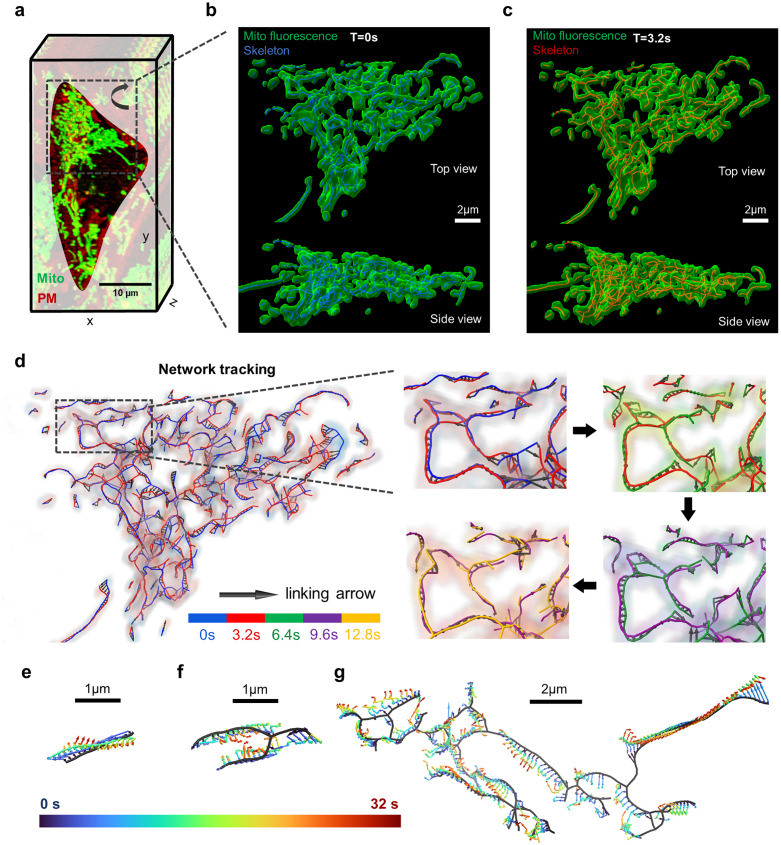
Fig 3. In-vitro validation and evaluation of 4D mitochondrial network tracking.
a, LLSM volumetric snapshot of a segmented cell. Green: mitochondrial network. Red: plasma membrane. b-c, Fluorescence signal and segmented network skeleton are overlaid for two consecutive frames (blue: 0s, red: 3.2s). d, Left: tracking of the skeleton nodes for the two frames in b) and c) are visualized by black arrows. Right: zoom-in to a representative region tracked over 12.8s. The skeletons are colored in blue, red, green, purple and orange in the order of time. e-g, Tracking of three representative mitochondrial network fragments for 32 seconds (time blue to red). e) A small fragment displays twisting motion. f) A medium-size fragment displays inward motion. g) A large fragment displays complex motion patterns.

