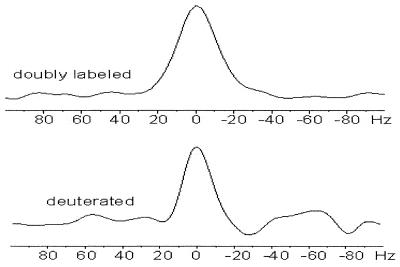
Figure 4.
1D traces in 1H direction through the G16 H1′–C1′ cross-peak (at 6.0/92.2 p.p.m.) in the HMQC spectrum of Figure 3, showing the acquired line narrowing upon deuteration. The G16 H1′–C1′ resonance has half height-line widths of 25 Hz (top) and 18 Hz (bottom) in the non-deuterated (indicated as doubly labelled) and deuterated samples, respectively.

