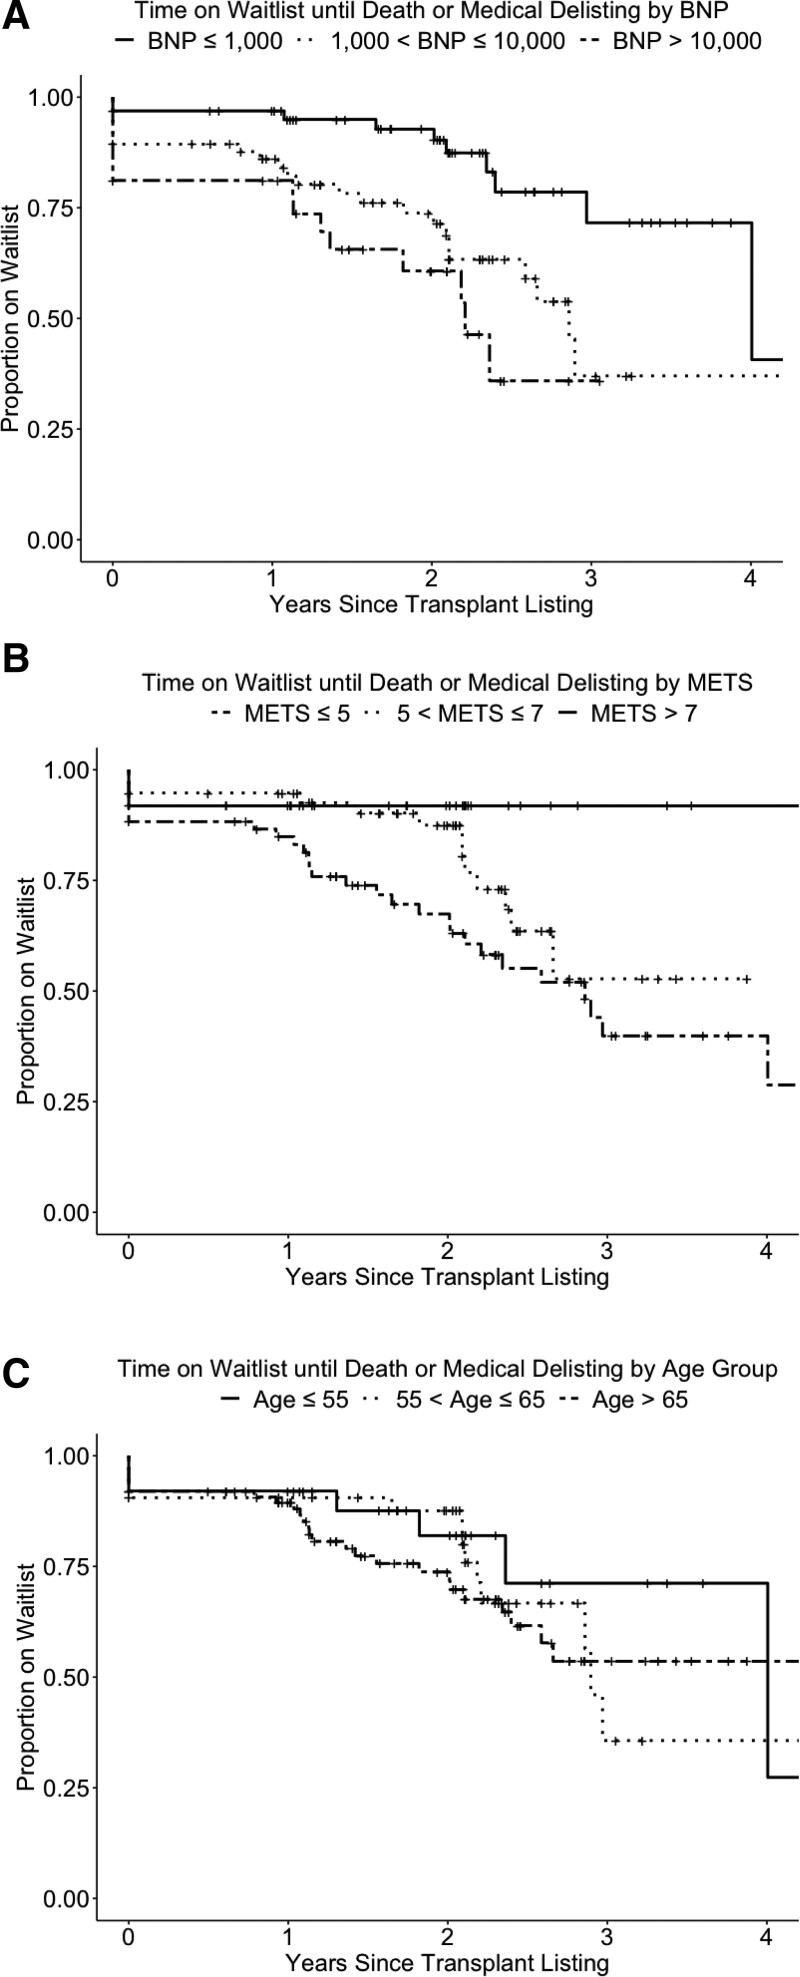
FIGURE 2.
Kaplan-Meier plots showing the effect of differences in the top predictor variables from backward Cox proportional hazard modeling censored for outcome events. A, Patients grouped by level of BNP (group 1: BNP ≤1000, group 2: BNP between 1000 and 10 000, and group 3: BNP >10 000). B, Patients grouped according to treadmill ability (group 1: ≤5 METS, group 2: between 5 and 7 METS, group 3: >7 METS). C, Patients grouped by age (group 1: ≤55 y old, group 2: between 55 and 65 y old, and group 3: >65 y old). BNP, N-terminal pro-brain natriuretic peptide; METS, metabolic equivalents.

