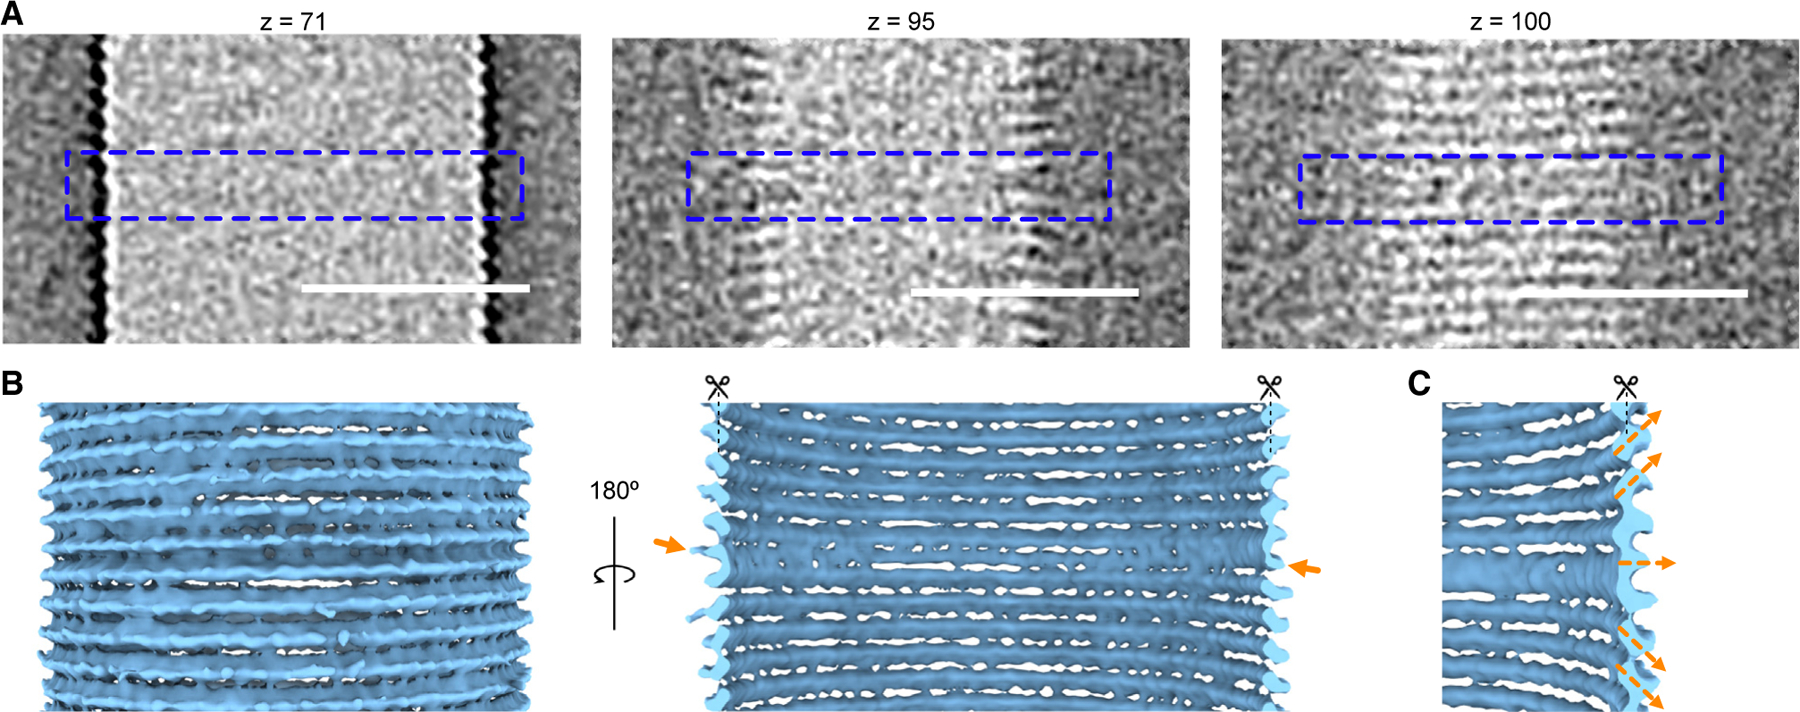
Figure 2. Polarity inversion point.

(A) Enlargement of the tomographic slices from Figure 1B (indicated by the orange dashed box) at different z heights. The blue dashed outlines indicate sections where polarity changes. Scale bars, 50 nm.
(B) Subtomogram average of the middle region of the GV where the ribs reverse polarity. Arrows denote the rib where polarity is reversed.
(C) Enlarged view of the subtomogram average in (B), highlighting the inversion of the helical assembly.
