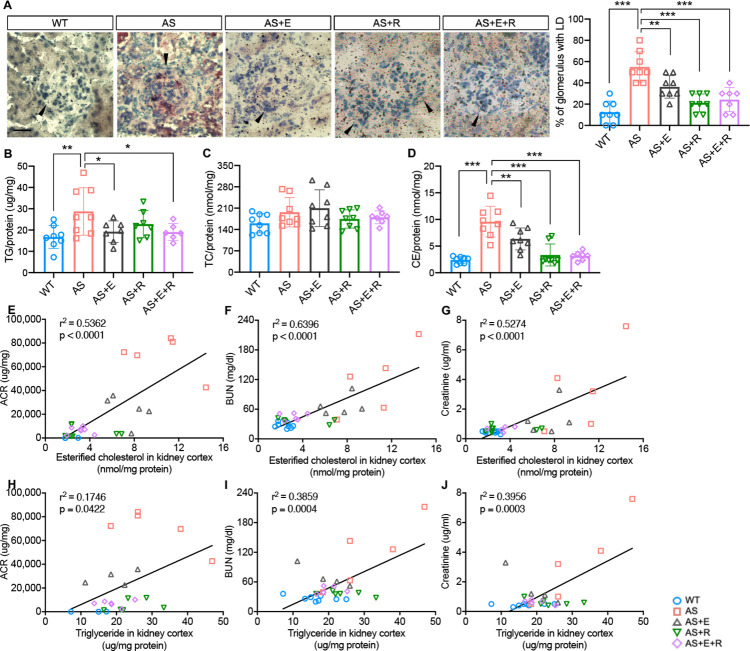
Figure 7. Empagliflozin prevents renal lipid accumulation in experimental Alport syndrome.
(A) Representative Oil Red-O (ORO) images of stained kidney cortices sections (scale bar: 20 μm) and bar graph quantification of the number of glomeruli with lipid droplets (LD) in ORO-stained slides (n = 7–8). (B–D) Bar graph analysis of triglyceride TG, (B), total cholesterol TC, (C), and cholesterol ester CE, (D) contents in kidney cortices. Values are normalized to protein concentrations (n = 6–8). (E–G) Correlation analyses between the CE content of kidney cortices and albumin-to-creatinine ratio (ACR), blood urea nitrogen (BUN), or creatinine (n = 27, 31, 31). (H–J) Correlation analyses between the TG content of kidney cortices and ACR, BUN, or creatinine (n = 29, 29, 29). (A–D), One-Way ANOVA followed by Holm-Sidak’s multiple comparisons. (E–J), Pearson’s correlation coefficient. *p< 0.05, **p< 0.01, ***p< 0.001.

