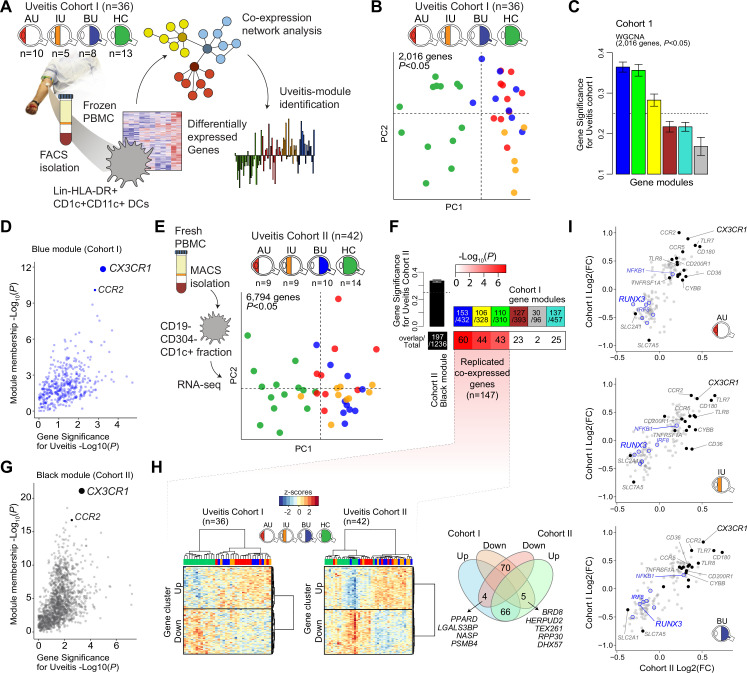
Figure 1. A CX3CR1 gene module in CD1c+ dendritic cells (CD1c+ DC) is associated with non-infectious uveitis.
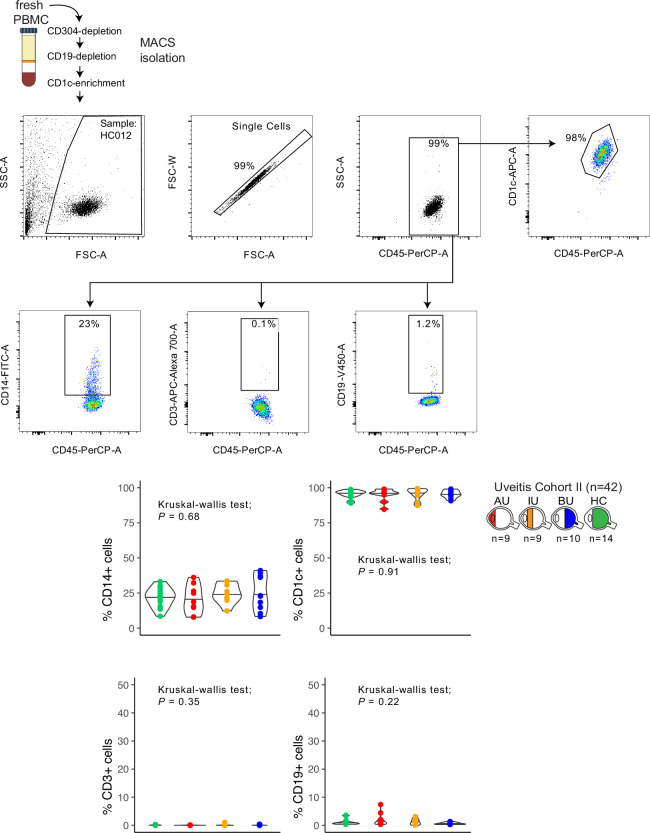
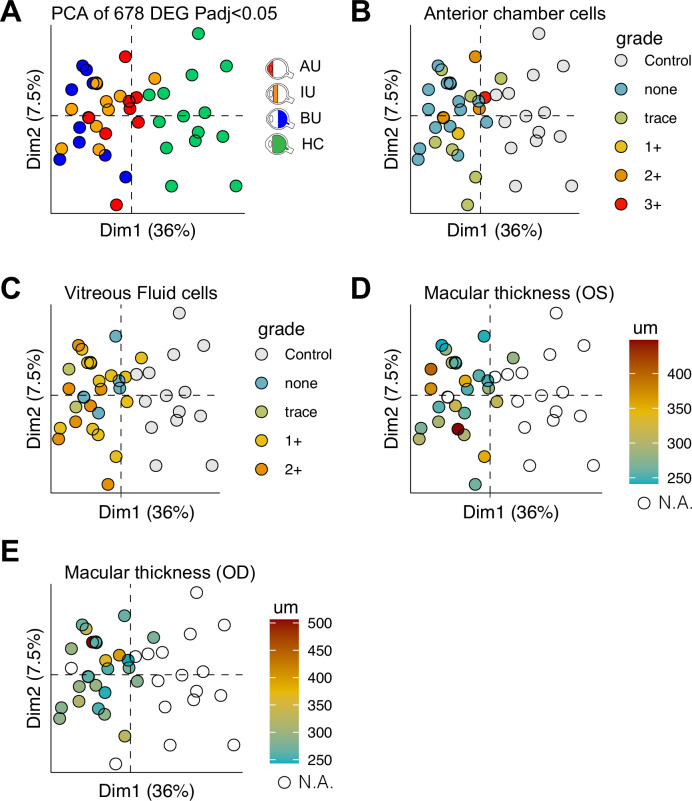
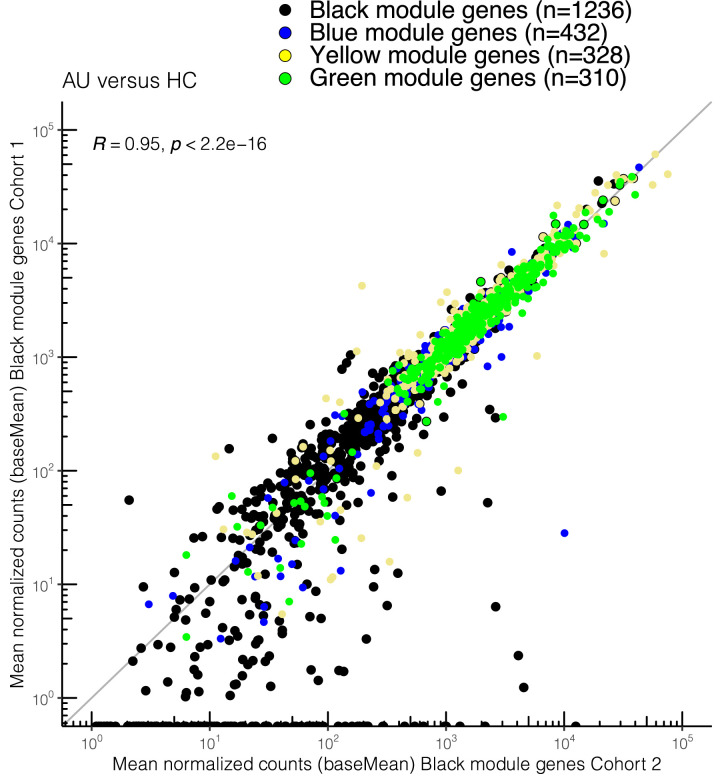
(A) Study design. CD1c+ DCs were purified from blood and subjected to RNA-sequencing. Co-expression network analysis was used to identify gene modules associated with uveitis. (B) Principal component analysis (PCA) of the 2016 uveitis-associated genes (p < 0.05) in 36 patients and control samples of cohort I. (C) Gene significance for uveitis for the gene modules identified by WGCNA. (D) Module membership and Gene Significance for uveitis for the blue module of cohort I. (E) PCA of the 6794 uveitis-associated genes (p < 0.05) in 42 samples of cohort II. (F) Cross-tabulation of the preservation of co-expressed genes between gene modules from cohort I and the black module from cohort II. p value is from Fisher’s exact test. (G) Same as in D, but for the black module of cohort II. (H) Heatmaps of the 147 replicated co-expressed genes (rows) for samples (columns) from cohorts I and II. The venn diagram shows the up- and downregulated genes (clusters shown in H). (I) The (log2) fold change in gene expression compared to healthy controls (x-axis) for all 147 replicated genes in patients with AU, IU, and BU. Genes encoding surface proteins are indicated in black/gray. Key transcription factors are indicated in blue. AU: anterior uveitis, IU: intermediate uveitis, BU: birdshot uveitis.


