. 2023 Apr 11;12:e84006. doi: 10.7554/eLife.84006

Figure 1. The occluded structure of DraNramp reveals a largely dehydrated Mn2+-coordination sphere.

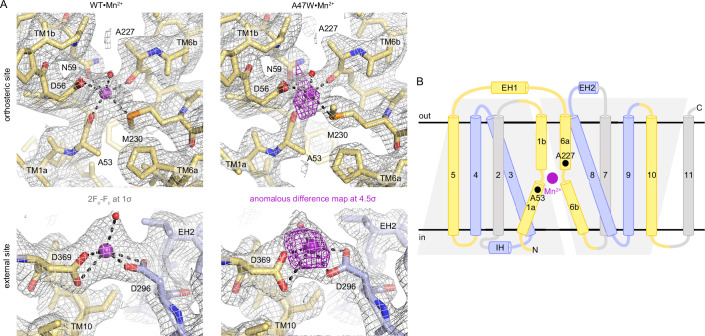
(A) Cartoon representation of WT•Mn2+ in an occluded state. Anomalous signal confirmed the presence of Mn2+ in both the orthosteric metal-binding site and an additional site at the mouth of the external vestibule (Figure 1—figure supplement 1A) which is less conserved across the Nramp family (Figure 1—figure supplement 3). TM1 and TM6 are labeled. (B) Detail of the orthosteric metal-binding site of WT•Mn2+ where D56, N59, M230, and the pseudo-symmetrically related carbonyls of A53 and A227 coordinate the Mn2+ ion (Figure 1—figure supplement 1B). A water molecule completes the six-ligand coordination sphere. Coordinating residues are shown as sticks, and coordinating distances are indicated in Å. (C) ITC measurement of the affinity of WT DraNramp for Mn2+. Top graph shows heat absorbed upon injection of Mn2+ solution to the protein solution. Bottom graph shows the fit of the integrated and corrected heat to a binding isotherm. The data show an endothermic mode of binding and fits best with a two-site sequential binding model. The figure shows one of three measurements and the average Kd values ± SEM (Kd1=190±30 µM, Kd2=1970±520 µM; see Appendix 1). Based on ITC experiments comparing Mn2+ binding to WT or DraNramp constructs with mutations at the external site (Figure 1—figure supplement 2A), we assigned Kd1 to the orthosteric site. In all figures, unless otherwise noted, TMs 1, 5, 6, and 10 are pale yellow, TMs 2, 7, and 11 gray, TMs 3, 4, 8, and 9 light blue, and Mn2+ atoms are magenta spheres.

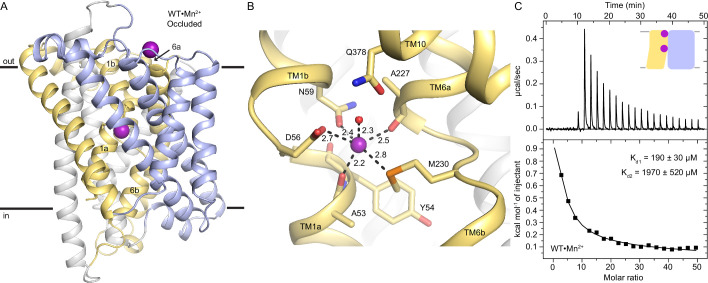
Figure 1—source data 1. Multiple sequence alignment of 6172 Nramp homologs.
Figure 1—source data 2. Maximum likelihood phylogenetic tree of Nramp homologs built with RAxML-NG.
Figure 1—source data 3. Raw data of metal ion uptake into proteoliposomes measured at four ΔΨ values for each DraNramp construct.
elife-84006-fig1-data3.xlsx (913.5KB, xlsx)

Figure 1.

Figure 1—figure supplement 1. Structure of Mn2+ binding at the orthosteric and external sites of DraNramp.

Figure 1—figure supplement 1.

(A) 2Fo-Fc (gray mesh; 1σ) and peaks from anomalous difference Fourier (magenta mesh; 4.5σ) maps calculated from the WT•Mn2+ and A47W•Mn2+ structures, respectively show Mn2+ bound at two sites, the orthosteric site (top) and an external site coordinated by D296 and D369 near the N-termini of EH2 and TM10, respectively (bottom). (B) Topology diagram showing the secondary structure organization of DraNramp with its characteristic LeuT fold, where TMs 1–5 and 6–10 form two pseudosymmetric inverted repeats. One intracellular helix, IH, and two extracellular helices, EH1 and EH2, connect TMs 2–3, 5–6, and 7–8, respectively. Black spheres indicate A53 in TM1a and A227 in TM6a, the two Mn2+-coordinating backbone carbonyls in the occluded state of DraNramp, one in each inverted repeat. Mn2+ is shown as magenta sphere.
Figure 1—figure supplement 2. Affinity of Mn2+ for the orthosteric and external sites of DraNramp and transport activity of external-site variants.

Figure 1—figure supplement 2.

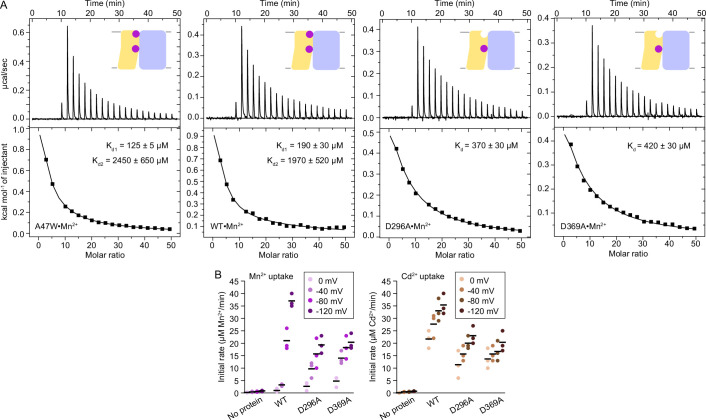
(A) ITC measurements of Mn2+ binding to A47W (which behaves like WT) and WT (reproduced here from Figure 1 for comparison) which fit best to a two-site sequential binding model, and D296A and D369A (constructs with point mutations to either of the external site aspartates), which were fit using a one-site model with a fixed n=1 (and did not fit with a two-site model). The resulting Kd values for D296A and D369A are more similar to Kd1 of WT, indicating that the orthosteric site has higher Mn2+ binding affinity compared to the external site. The figure shows one of 2–3 measurements and the average Kd values ± SEM (see Appendix 1). (B) Initial metal uptake rates for DraNramp mutants at membrane potentials ranging from ΔΨ=0 to −120 mV (n=3; each data point is represented in the scatter plots and the black bars are the mean values). The metal ion concentration was 750 μM, and the pH was 7 on both sides of the membrane. D296A and D369A moderately reduced the initial transport rate at high membrane potentials. The overall trends are similar for both metals. Mn2+ transport showed higher voltage dependence than Cd2+ transport. Corresponding time traces are plotted in Figure 1—figure supplement 4.
Figure 1—figure supplement 3. The external metal-binding site in DraNramp is somewhat conserved in clade A homologs, but poorly conserved across all Nramps.

Figure 1—figure supplement 3.

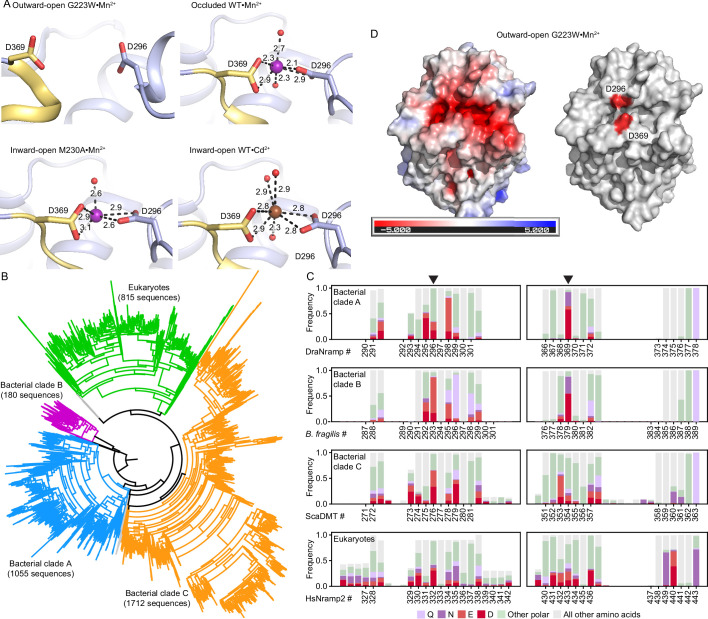
(A) External site architecture in the G223W•Mn2+ (outward-open), WT•Mn2+ (occluded), M230A•Mn2+ and WT•Cd2+ (inward-open) structures showing positions of D296 and D369 across conformations, illustrating that the two residues are farther apart in the outward-open structure and cannot bind metal. Metal-coordinating distances are listed in Å. (B) A maximum likelihood phylogenetic tree illustrating evolutionary divergence of the Nramp family into several major clades for prokaryotes (clades A, B and C) and eukaryotes. (C) Frequencies of acidic and other polar amino acids in the loop regions surrounding D296 (left; loop preceding EH2) and D369 (right; loop preceding TM10) across phylogenetic clades, based on the sequence alignment used to build the tree in panel B (bacterial clade A, DraNramp numbering; bacterial clade B, Bacteroides fragilis MntH numbering; bacterial clade C, ScaDMT numbering; eukaryotic clade, human Nramp2 numbering). Across all clades, these two external loops have a high concentration of acidic amino acids. However, the exact positions of acidic residues observed in DraNramp—296 and 369 (arrowheads)—are not highly conserved except 369 in bacterial clades A and B, which is an aspartate, asparagine, or glutamate in most sequences (92.1% and 87.8% in clades A and B, respectively) (D) APBS (Jurrus et al., 2018)-generated electrostatic surface potential of the outward-open structure viewed from the extracellular side illustrates that D296 and D369 contribute to a funnel of negative charge leading into the orthosteric binding site.
Figure 1—figure supplement 4. Representative time traces of metal ion uptake into proteoliposomes (n=2–3) measured at four ΔΨ values for each DraNramp construct.

Figure 1—figure supplement 4.

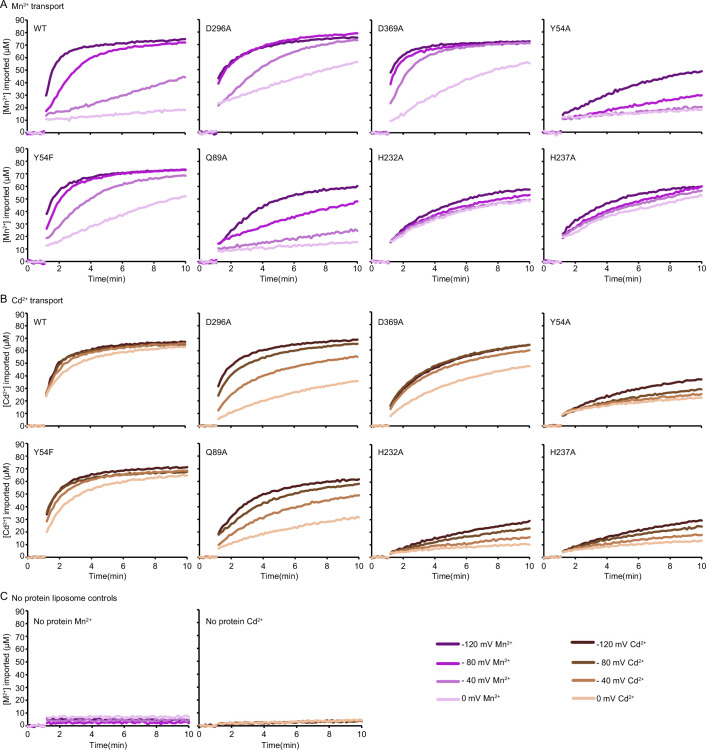
(A, B) Mn2+ (A) and Cd2+ (B) uptake for WT and mutant DraNramp constructs. (C) Representative time traces of Mn2+ (left) and Cd2+ (right) uptake (n=3) shows that no metal was imported into control liposomes. The initial metal uptake rates calculated from these time traces are in Figure 1—figure supplement 2A, Figure 3C, and Figure 5—figure supplement 4F. The source data for all plots are provided as Figure 1—source data 3.