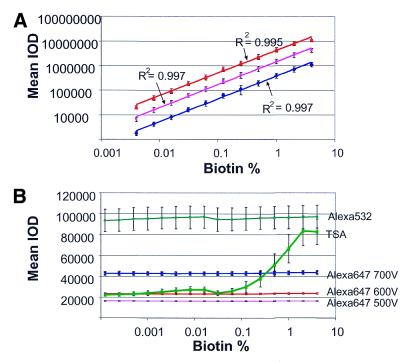
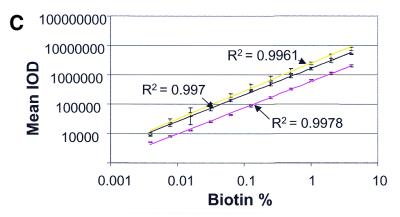
Figure 2.
The biotinylated probe chip: linearity, variability, sensitivity and local background uniformity of the detection process. (A) Slides were processed with streptavidin-Alexa 647 and scanned at PMT voltages of 500 (blue line), 600 (pink line) and 700 (red line). Each data point represents the average of 16 replicates per slide. (B) Slides were processed with streptavidin-Alexa 532 (light green line), TSA (dark green line) or streptavidin-Alexa 647 scanned at PMT voltages of 500 (pink line), 600 (red line) and 700 (blue line). The local background was represented by the two-pixel median of each spot on the slide. (C) Slides were processed with streptavidin-Alexa 647 (yellow line), streptavidin-cy3 (black line) or streptavidin-phycoerythrin (pink line) and scanned at a PMT voltage of 600.


