Figure 3.
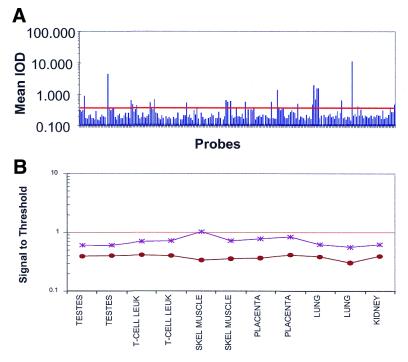
The negative control threshold can be used to define the lower limits of detection. (A) Graph showing mean IOD for negative control probes used to calculate the threshold. Each slide has 216 negative control probes (54 probes in 4× redundancy). Threshold was calculated using 20% trim mean for each slide (10% of the highest signals and 10% of the lowest signals were removed from the probes population) and the remaining probes were used to calculate the threshold. Of the untrimmed population, 9.44% of the negative control probes is above the threshold. The line indicates the threshold as calculated by the mean and three standard deviations. (B) The negative control values are constant in six different samples. The mean (asterisks) and median (circles) negative control values were calculated in six tissues (each tissue was hybridized in duplicate).

