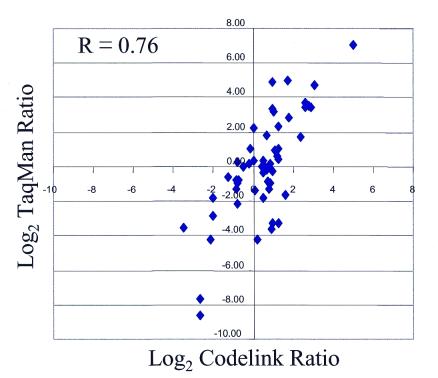
Figure 8.
Correlation of differential expression ratios with TaqMan®. The log2 of the differential expression ratio obtained with TaqMan® when heart and brain were compared was plotted on the y-axis versus the log2 of the ratio obtained with the CodeLink™ Expression Bioarray platform using the same RNAs on the x-axis. The correlation coefficient (R = 0.76) was based on all 54 genes.

