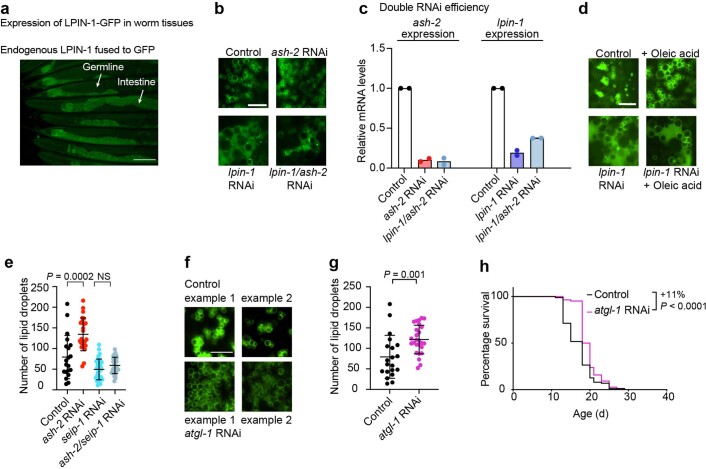
Extended Data Fig. 2. Lipid droplet perturbations that are important for longevity.
a, Endogenous LPIN-1 expression, measured by fluorescence of GFP tagged to the C-terminus of LPIN-1 at the endogenous lpin-1 locus. Fluorescent images of the anterior and posterior parts of young adult lpin-1(wbm76[lpin-1::GFP]) worms. Scale bar, 100 µm. b, Intestinal lipid droplets, assessed by fluorescence, in dhs-3p::dhs-3::GFP transgenic worms following lpin-1 and ash-2 depletion. Zoomed-in images of the intestine. Scale bar, 5 µm. Lipid droplet number is quantified in Fig. 3b. c, RNAi efficiency in conditions using two RNAi constructs. RT–qPCR on RNA extracted from worms treated with control, ash-2, lpin-1 and ash-2 + lpin-1 RNAi. The mRNA levels of target genes relative to act-1 mRNA levels were normalized to the empty vector controls. Data are the mean of two independent experiments, with three replicates each. d, Intestinal lipid droplets, assessed by fluorescence, in dhs-3p::dhs-3::GFP transgenic worms following lpin-1 depletion and oleic acid supplementation. Zoomed-in images of the intestine. Scale bar, 5 µm. Lipid droplet number is quantified in Fig. 3c. e, Quantification of intestinal lipid droplet number, measured by fluorescence, in dhs-3p::dhs-3::GFP worms following seip-1 and ash-2 depletion; n = 20, 25, 31 and 28 worms treated with control, ash-2, seip-1, and ash-2 + seip-1 RNAi, respectively. Data are the mean ± s.d. Each dot represents the lipid droplet number in a 26 × 26 µm2 area in the intestine of an individual worm. P values: two-tailed Mann–Whitney test. Lipid droplets shown in Fig. 3f. f,g, Intestinal lipid droplet number, assessed by fluorescence, in dhs-3p::dhs-3::GFP worms following atgl-1 depletion. f, Zoomed-in images of the intestine. Scale bar, 5 µm. g, Quantification of lipid droplet number; n = 20 and 26 worms treated with control and atgl-1 RNAi, respectively. Analysis as in e. h, Atgl-1 knockdown extends lifespan; n ≥ 108 worms for each condition. The percentage of median lifespan extension and P values are indicated. P values: log-rank Mantel–Cox test. a,e,h, Representative of two independent experiments. g, Representative of three independent experiments. Source numerical data of all experiments, replicates and statistics are provided.

