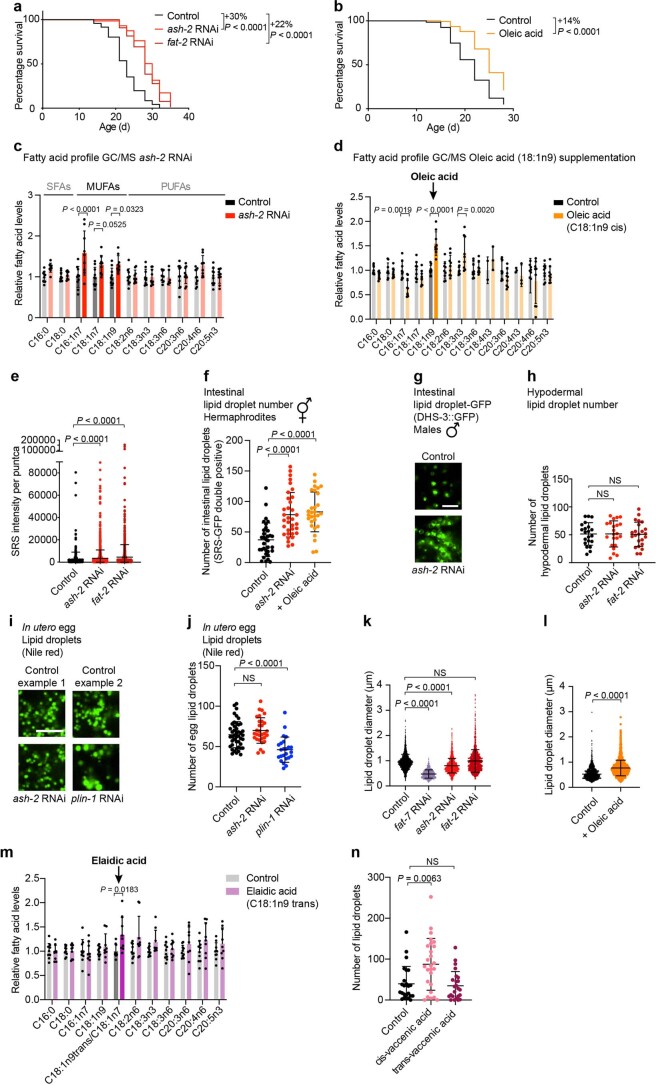
Extended Data Fig. 1. Perturbations that increase MUFAs and their effect on lipid droplets.
a, ash-2 or fat-2 depletion extends lifespan; n ≥ 92 worms for each condition. Percentage of median lifespan extension and P values are indicated. P values: log-rank Mantel–Cox test. b, Dietary oleic acid supplementation extends lifespan; n ≥ 135 worms for each condition. Analysis as in a. c, Fatty acid profile by GC–MS following ash-2 depletion. Fatty acid levels were normalized to the control condition. Data are the mean ± s.d. of three independent experiments, each with three biological replicates. Significant P values are shown. P values: two-way ANOVA with Bonferroni’s multiple comparison test. d, Fatty acid profile by GC–MS following oleic acid supplementation. Analysis as in c. e, Puncta intensity, quantified by SRS microscopy; n = 420, 1,603 and 927 puncta in ≥18 worms treated with control, ash-2 RNAi and fat-2 RNAi, respectively. Data are the mean ± s.d. Each dot represents the SRS signal intensity of one puncta. Lower segment of the y axis displays values of 0–90,000; upper segment of the y axis of 90,000–200,000. P values: two-tailed Mann–Whitney test. f, Quantification of intestinal lipid droplet number (double-positive puncta), measured by SRS microscopy, in dhs-3p::dhs-3::GFP worms following MUFA accumulation; n = 33, 34 and 29 worms treated with control and ash-2 RNAi, and following oleic acid supplementation, respectively. Data are the mean ± s.d. Each dot represents the lipid droplet number in a 26 × 26 µm2 area in the intestine of an individual worm. P values: two-tailed Mann–Whitney test. Lipid droplets shown in Fig. 1d. g, Intestinal lipid droplets, assessed by fluorescence, in dhs-3p::dhs-3::GFP worms (males) following ash-2 depletion. Zoomed-in images of the intestine. Scale bar, 5 µm. Lipid droplet number quantified in Fig. 1g. h, Quantification of hypodermal lipid droplet number, measured by fluorescence, in plin-1p::plin-1::mCherry worms following MUFA accumulation; n = 21, 22 and 23 worms treated with control, ash-2 and fat-2 RNAi, respectively. Data are the mean ± s.d. Each dot represents the lipid droplet number in a 15 × 15 µm2 area of an individual worm. Lipid droplets shown in Fig. 1h. P values: two-tailed Mann–Whitney test. i,j, Lipid droplets in eggs (in utero), assessed by Nile red fluorescence, following ash-2 depletion. i, Zoomed-in images of one egg per condition. Scale bar, 5 µm. j, Quantification of lipid droplet number; n = 45, 30 and 24 eggs in ≥15 worms treated with control, ash-2 and plin-1 RNAi, respectively. Data are the mean ± s.d. Each dot represents the lipid droplet number in a 16 × 16 µm2 area of an individual egg. P values: two-tailed Mann–Whitney test. k,l, Lipid droplet size, measured by fluorescence, in dhs-3p::dhs-3::GFP worms following MUFA accumulation. k, Quantification of lipid droplet diameter; n = 1,720, 875, 1,803 and 1,550 lipid droplets in ≥14 worms treated with control, fat-7, ash-2 and fat-2 RNAi, respectively. Data are the mean ± s.d. Each dot represents the diameter of one lipid droplet. P values: two-tailed Mann–Whitney test. l, Quantification of lipid droplet diameter; n = 1,299 and 2,168 lipid droplets in ≥20 worms following control and oleic acid supplementation, respectively. Analysis as in k. m, Fatty acid profile by GC–MS following elaidic acid supplementation. Data are the mean ± s.d of two independent experiments, each with three biological replicates. Analysis as in c. n, Quantification of intestinal lipid droplet number, measured by fluorescence, in dhs-3p::dhs-3::GFP worms following dietary cis- or trans-vaccenic acid supplementation; n = 24, 26 and 24 worms following control, and dietary cis- and trans-vaccenic acid supplementation, respectively. Analysis as in f. a, Representative of three independent experiments. b, Representative of four independent experiments. e,f,h,j,k,l,n, Representative of two independent experiments. Source numerical data of all experiments, replicates and statistics are provided.

