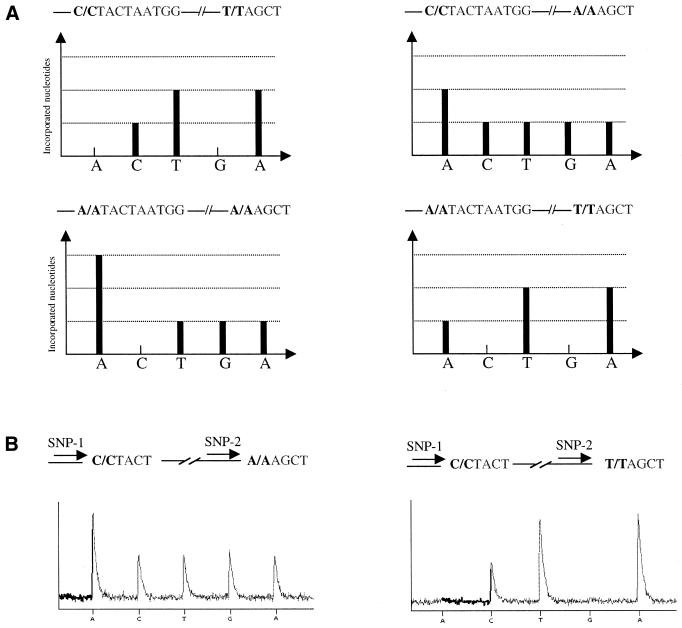
Figure 2.
Schematic demonstration of the expected patterns obtained from multiplex analyses of two SNPs residing on a DNA template (A). Raw data in the pyrogram demonstrate two of the four possible expected patterns (B). The correct sequences are shown above each pyrogram and the order of dispensation is demonstrated below the pyrograms.

