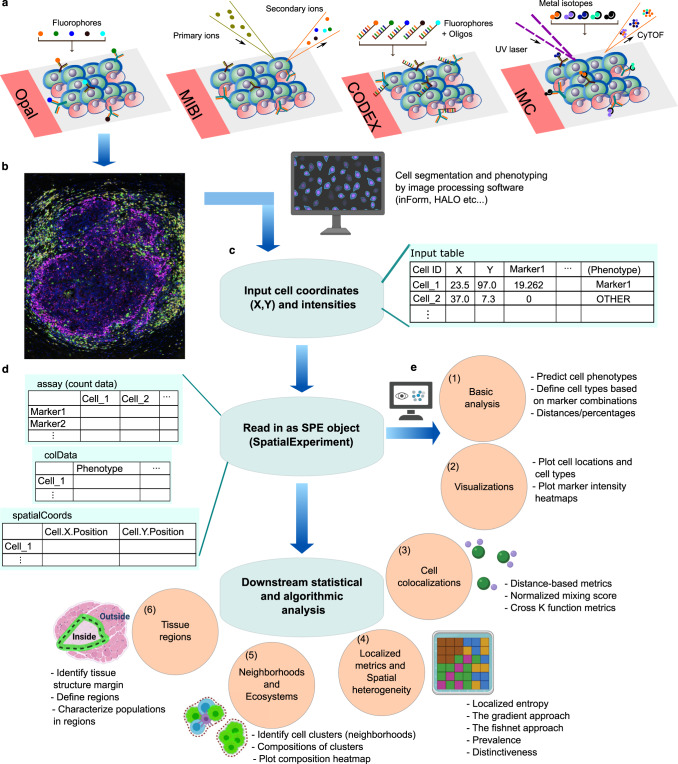
Fig. 1. Overview of SPIAT analysis modules.
a Examples of technologies used to generate spatial proteomics data. b These platforms generate multiplex images, which are then processed by image analysis software to perform cell segmentation and marker deconvolution. c This results in data in the form of a table with cell coordinates and cell phenotypes and/or marker intensities that can be exported from the image analysis software. d SPIAT begins by reading in this table of cell IDs, X, Y coordinates, cell phenotypes (if available), and marker intensities (if available). Any other additional columns of data are optional and not required. Any data format that can be read into R, with cell coordinates as vectors and matched cell phenotypes and/or marker intensities, can be used as input to SPIAT. This table is then converted to a SpatialExperiment object by SPIAT, a widely used format for spatial data in R. e This is followed by analysis by one of six analysis modules. Users can predict cell phenotypes or define cell types directly as well as perform basic quality control and calculate basic metrics such as cell percentages and cell distances (1), followed by visualization of the spatial distribution of cells (2), quantification of cell colocalization through seven distinct methods (3), measure spatial heterogeneity (4), detect neighborhoods or ecosystems of cells based on clustering and community detection (5), and characterize cell types relative to the margin of tissue structures, such as the tumor margin (6). Created with BioRender.com. SPE spatial experiment object.

