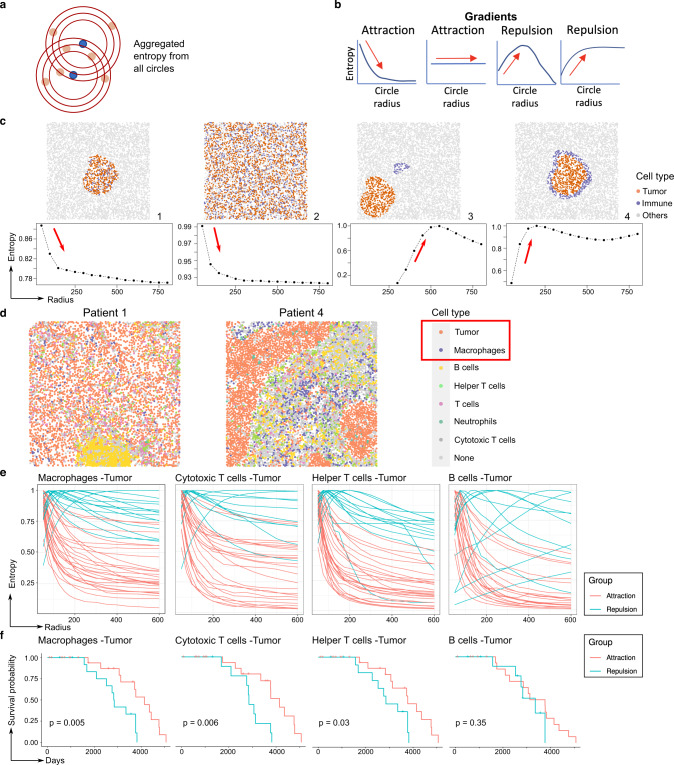
Fig. 4. Entropy gradients for self-contained sample classification.
a Entropy is calculated from concentric circles around cells from a reference cell population. b Entropy scores are then displayed as a gradient along a radius. The shape of the entropy gradient curves is used to classify patterns as attraction or repulsion. c Simulations of different levels of colocalization between immune and tumor populations and the resulting entropy gradient curves. The slope of the curve allows a self-contained classification of samples. d Examples of the spatial distribution of immune cells in TNBC samples, showing either attraction of tumor cells and macrophages (Patient 1) or repulsion between these cell types (Patient 4). We used SPIAT to predict the phenotypes de novo based on the marker intensities of CD3, CD4, CD8, CD20, MPO, and CD68 to identify helper and cytotoxic T cells, B cells, neutrophils, and macrophages. e Entropy gradients of macrophages, cytotoxic T cells, helper T cells, and B cells with tumor cells in the TNBC MIBI dataset. Each curve corresponds to a sample. Samples were classified based on their initial slope (near zero radius) with negative (attraction) and positive (repulsion) slopes. n = 40 samples from 39 patients. Samples without the relevant cell types were excluded from the particular plot. f Kaplan–Meier survival analysis of the classified samples. The time shown corresponds to days to death. A significant association was found for the interactions involving macrophages and cytotoxic and helper T cells, but not B cells. p values calculated using a two-sided log-rank test. No adjustment for multiple comparisons was performed. n = 36, 31, 35, and 30 patients, respectively. Patients with samples without the relevant cell types were excluded from the survival analysis. Source data are provided as a Source Data file.

