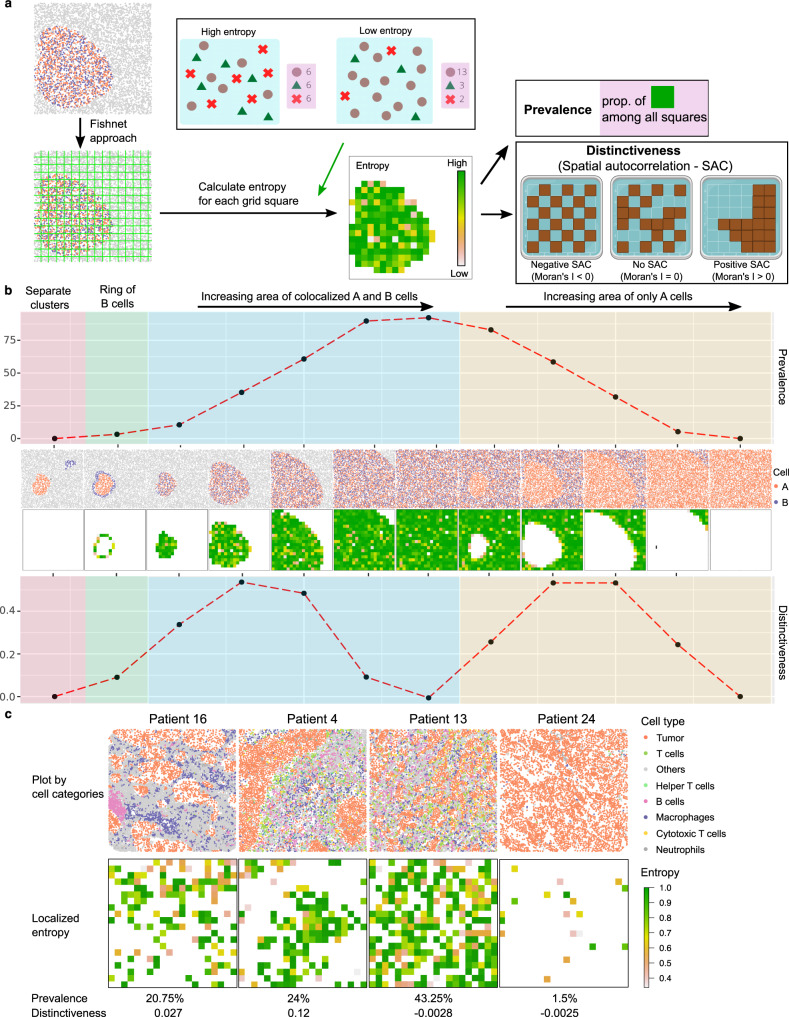
Fig. 5. Spatial heterogeneity metrics in SPIAT.
a Calculation of spatial heterogeneity of a pattern. A fishnet is used to split an image into grid squares. Next, the pattern of interest is quantified in each grid square. The Prevalence of a pattern is the percentage of grid squares positive for the pattern, and the Distinctiveness refers to how common the pattern is in the image, calculated by global spatial autocorrelation. Triangles, circles and crosses represent different cell types. b Calculation of the Prevalence and Distinctiveness of a pattern of co-occurring A and B cell populations measured using entropy in a set of simulated images. Note that the two metrics do not mirror each other. Images with an even spread of A and B cells have a high Prevalence but low Distinctiveness. Images where a pattern is found in confined areas tended to have higher Distinctiveness scores and lower Prevalence scores. c Prevalence and Distinctiveness scores in the TNBC cohort of a pattern of colocalization of tumor cells and macrophages. Source data are provided as a Source Data file. Created with BioRender.com.

