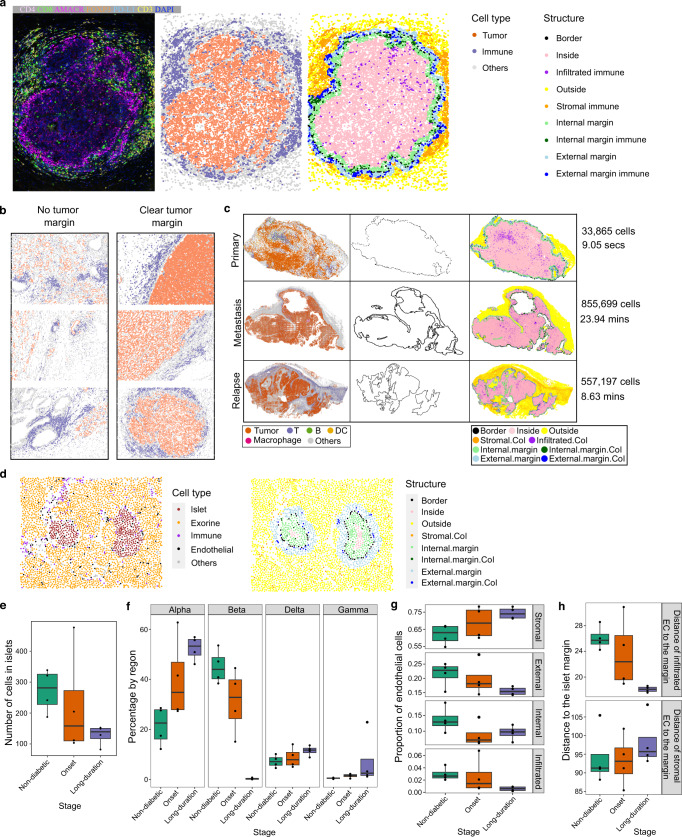
Fig. 6. Automated classification of cells relative to a tissue structure margin performed by SPIAT.
a Tumor margin detection and immune cell classification relative to tumor margin in a prostate cancer tissue. b Prostate cancer tissues with and without clear tumor margins based on R-BC scores. Shown are the top three and bottom three images with the highest and lowest scores, with a minimum of 300 tumor cells and 300 immune cells. Color codes of panel a were used. c Tumor margin detection and immune cell classification in melanoma. The time displayed corresponds to runtime on a local computer (16 GB RAM, 8-core CPU, Apple M1 Pro Chip). Highlighted cells of interest (CoI) are T cells, B cells and DCs for primary and relapse samples, and macrophages, T cells, B cells and DCs for the metastasis sample. d Pancreatic tissue islet of a patient at the onset of diabetes, showing individual cell types and the detection of islet margin and areas by SPIAT. e Islet size reduced during disease progression. Decreasing one-sided JT p value = 0.033. f Percentage of islet cell types in islets. The percentage of beta cells decreases as the disease progresses, whereas other cell types increase. Decreasing one-sided JT p value = 6.40 × 10⁻⁴ for beta cells. Increasing one-sided JT p values = 6.15 × 10⁻³, 0.063, 9.93 × 10⁻³ for alpha, delta, and gamma islet cell types, respectively. g Distribution of EC relative to islet structures. The proportion of EC in the stroma increases during progression (increasing one-sided JT p value = 0.023), but becomes depleted within islets and in the external margins of islets (decreasing one-sided JT p value = 0.015 and 0.03, respectively). The internal margin showed no trend (one-sided JT p value = 0.11). h Distance of infiltrated and stromal EC to islet margins. Infiltrated EC localize closer to the islet margin during progression (decreasing one-sided JT p value = 0.0020), but stromal EC become further away from islet margins (increasing one-sided JT p value = 0.14). e–h n = 12 biologically independent samples. In boxplots, the center line corresponds to the median and the box limits correspond to the first and third quartiles (the 25th and 75th percentiles). The upper and lower whiskers extend to the maximum or minimum value within 1.5 times the interquartile range, respectively. CoI Cells of interest, secs seconds, mins minutes. Source data are provided as a Source Data file.

