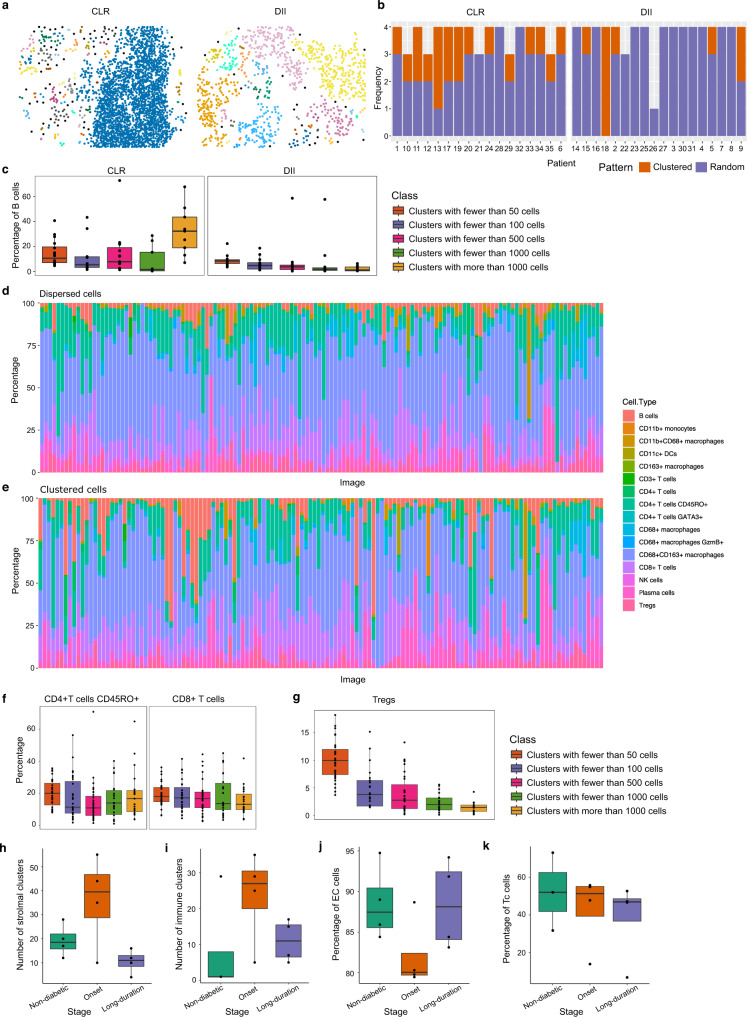
Fig. 7. Identification of cellular neighborhoods with SPIAT.
a CLR and DII example samples from the CODEX dataset. Cells are colored based on cluster membership. b Detection of significant clustering of B cells using the ANNI. Samples without B cells were excluded. c Higher percentage of B cells in the largest cluster in CLR samples, but not DII samples. n = 126 cell clusters computed from 35 biologically independent samples. d Percentage of immune cell types in the dispersed immune population. e Percentage of immune cell types in the clustered immune population. f The percentage of CD45RO+ CD4+ T cells and CD8+ T cells across cluster sizes is similar. Adjusted two-sided JT p value = 0.10 for both. n = 268 cell clusters computed from 35 biologically independent samples. g Larger clusters have lower percentages of Tregs. Adjusted one-sided JT p value = 2.96 × 10⁻¹⁵. n = 120 cell clusters computed from 35 biologically independent samples. h Average number of stromal clusters per sample by stage in the IMC dataset. Samples taken at the onset of diabetes have a higher number of stromal clusters (one-sided Wilcoxon rank-sum test p values = 0.17 and 0.073, respectively). i Average number of immune clusters per sample by stage. Samples taken at the onset of diabetes have a higher number of clusters of immune cells (one-sided Wilcoxon rank-sum test p values = 0.068 and 0.12, respectively). j Percentage of endothelial cells in stromal clusters. The percentage decreases at the onset of diabetes, but returns to non-diabetic levels in the long-term diabetes samples (one-sided Wilcoxon rank-sum test p value = 0.057 for both comparisons). k Percentage of Tc cells in immune clusters. The percentage of Tc cells decreases during progression (one-sided JT p value = 0.13). h–k n = 12 biologically independent samples. In boxplots, the center line corresponds to the median and the box limits correspond to the first and third quartiles (the 25th and 75th percentiles). The upper and lower whiskers extend to the maximum or minimum value within 1.5 times the interquartile range, respectively. CLR Crohn’s-like reaction pathology, DII diffuse inflammatory infiltration pathology, EC endothelial cells, Tc cytotoxic T cells. Source data are provided as a Source Data file.

