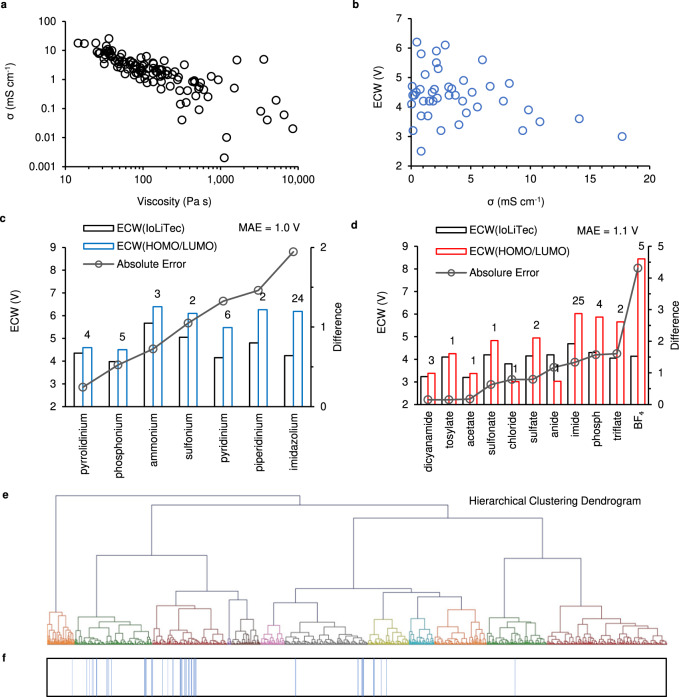
Fig. 2. Unsupervised learning of the dataset.
a The relationship between σ and viscosity of the ILs with known properties in the dataset. b The relationship between the σ and the ECW of the ILs with known properties in the dataset. c, d Comparison of ECW based on IoLiTec to ECW based on HOMO/LUMO theory for the cation (c) and anion (d) types, correspondingly. The mean absolute error (MAE) is also indicated. e Hierarchical clustering dendrogram for the ILs based on the top 15 features (when classifying the conductivity type of the ILs in the supervised learning) and the calculated ECWs. f The blue lines show the screened ILs based on the supervised, which is highly consistent with the clustering results achieved by the unsupervised learning shown in (e).

