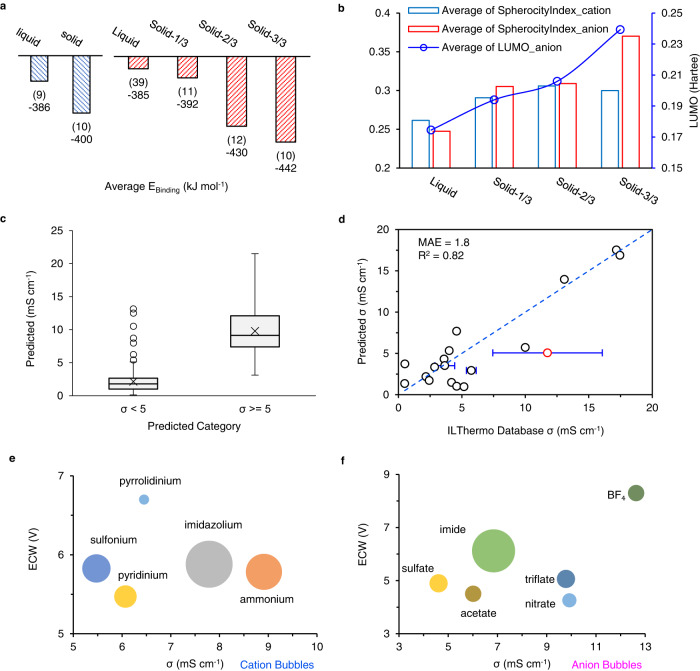
Fig. 3. Supervised learning of the dataset.
a The column plots for the average binding energy (Ebinding) between cations and anions in specific groups. Blue columns show the average Ebinding for the ILs with known phases. Red columns show the average Ebinding for the ILs with predicted phases, including liquid and solid-x/3, where x (x = 1, 2, 3) is the number of ML models (SVM, RF, XGB) with prediction results being in solid phase for the ILs. The column labels refer to the number of ILs and the average Ebinding in each group. b The key features when classifying solid/liquid phases of the candidates and their average values for each group. c The boxplots of predicted σ for the two categories with σ ≥ 5 mS cm−1 or not. d Comparison of the predicted σ in the test dataset to literature reported σ in the ILThermo Database at 25 °C. The horizontal error bar shows the standard deviation of the experimental values stored in ILThermo database. The red circle is excluded in validation for its substantial uncertainty. e, f The bubble plots show the relationship between ECW and σ of the final recommended ILs grouped by cation and anion types, separately. The bubble size refers to the count of ILs in each category.

