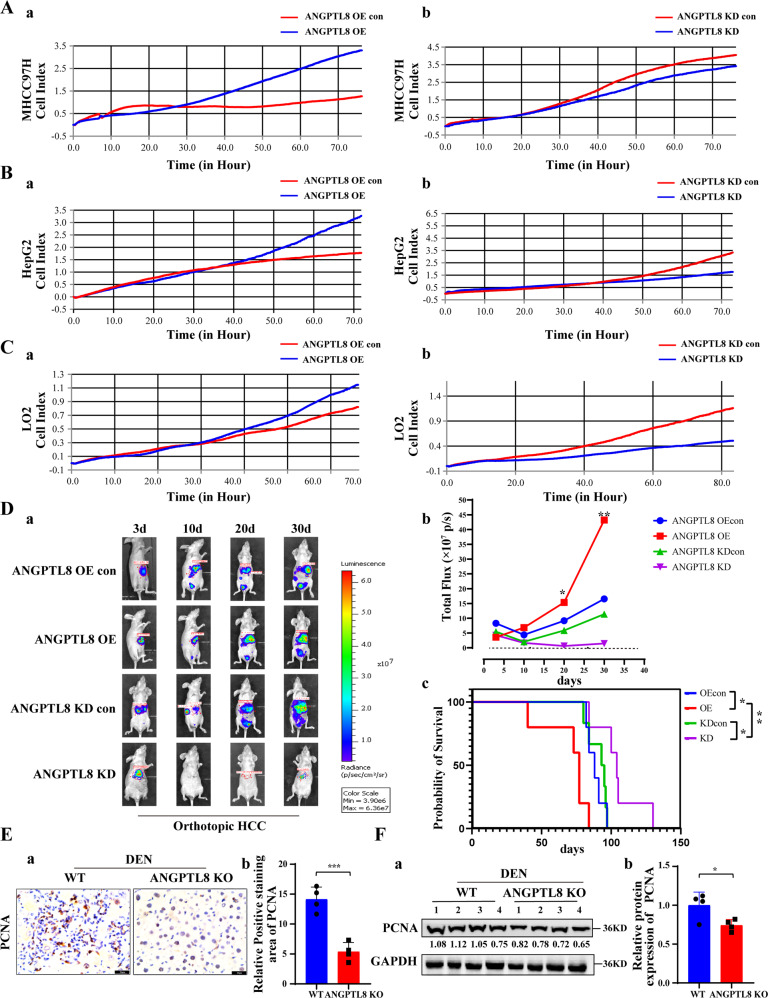
Fig. 2. ANGPTL8 promotes proliferation in HCC and normal liver cells in vitro and in vivo.
A–C Proliferation of A MHCC97H, B HepG2, and C LO2 cells with ANGPTL8 OE or KD by RTCA. D (a, b) Analysis of the growth of orthotopically implanted WT, ANGPTL8-KD or ANGPTL8-OE MHCC97H-Luc tumor cells by bioluminescence imaging (n ≥ 5 per group). (c) For the survival experiments, the time of death of every mouse was recorded after the orthotopic tumor formation experiment in nude mice. Data are the mean ± SD. Statistical comparisons were performed using Student’s t test. *p < 0.05, **p < 0.01. E IHC staining of PCNA in liver tissue from DEN-induced WT and ANGPTL8-KO HCC mice (n = 4 per group). Data are the mean ± SD. Statistical comparisons were performed using Student’s t test. ***p < 0.001. F Western blot analysis of PCNA expression in liver tissue from DEN-induced WT and ANGPTL8-KO HCC mice (n = 4 per group). Protein expression was normalized to GAPDH, and the numbers represent the mean ± SD from an average of 4 independent experiments. Statistical comparisons were performed using Student’s t test. *p < 0.05.

