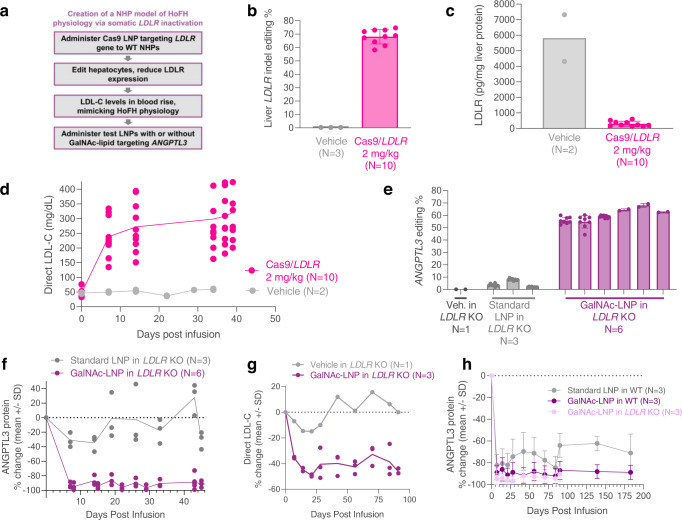
Fig. 3. Demonstration of adenine base editing by GalNAc-LNPs targeting ANGPTL3 in the liver of a somatic LDLR-deficient NHP model.
a Schematic detailing the creation of the somatic low-density lipoprotein receptor (LDLR) deficient/knockout (KO) model in non-human primates (NHPs) using CRISPR-Cas9 lipid nanoparticles (LNPs). 2–3-year-old wild-type (WT) male cynomolgus NHPs were treated with 2 mg/kg of SpCas9 dual-gRNA LNPs targeting the LDLR gene, editing and disrupting LDLR in the liver. b Liver biopsy demonstrated editing of 68% of all LDLR alleles in a liver biopsy. c LDLR protein levels assayed by ELISA on a second liver biopsy were markedly reduced by 95%, and (d) blood low-density lipoprotein cholesterol (LDL-C) increased from ~50 mg/dL to ~300 mg/dL. LNPs without GalNAc-Lipid were not effective in LDLR-deficient NHPs, yielding (e) 4.5% ANGPTL3 editing and (f) minimal or no ANGPTL3 protein reductions at a 2 mg/kg dose. GalNAc-LNPs at a 2 mg/kg total RNA dose and with 0.05 mol % GL6 resulted in rescue of (e) high-efficiency liver ANGPTL3 editing and (f) durable 89% reduction in blood ANGPTL3 protein out to three months. In panel (e), each column represents an NHP, and editing results reflect liver biopsy (1-2) or necropsy (8) samples. In the homozygous familial hypercholesterolemia HoFH NHP model with markedly elevated baseline LDL-C levels of ~300 mg/dL, editing of ANGPTL3 with GalNAc-LNPs (g) lowered LDL-C (~35%, or ~100 mg/dL in absolute terms) out to three months. h Comparison of blood ANGPTL3 reductions out to six months in WT NHPs dosed with either standard LNPs or GalNAc-LNPs at 2 mg/kg. Data are presented as mean values + /- standard deviation (where error bars are present) and individual data points for each animal are displayed in panels (b–g). Panels (d), (f), and (g) have the means plotted as a line along with the individual points. Panel (h) averages three ANGPTL3 protein values from three distinct NHPs and the data are presented as mean values + /- standard deviation. Source data are provided as a Source Data file.

