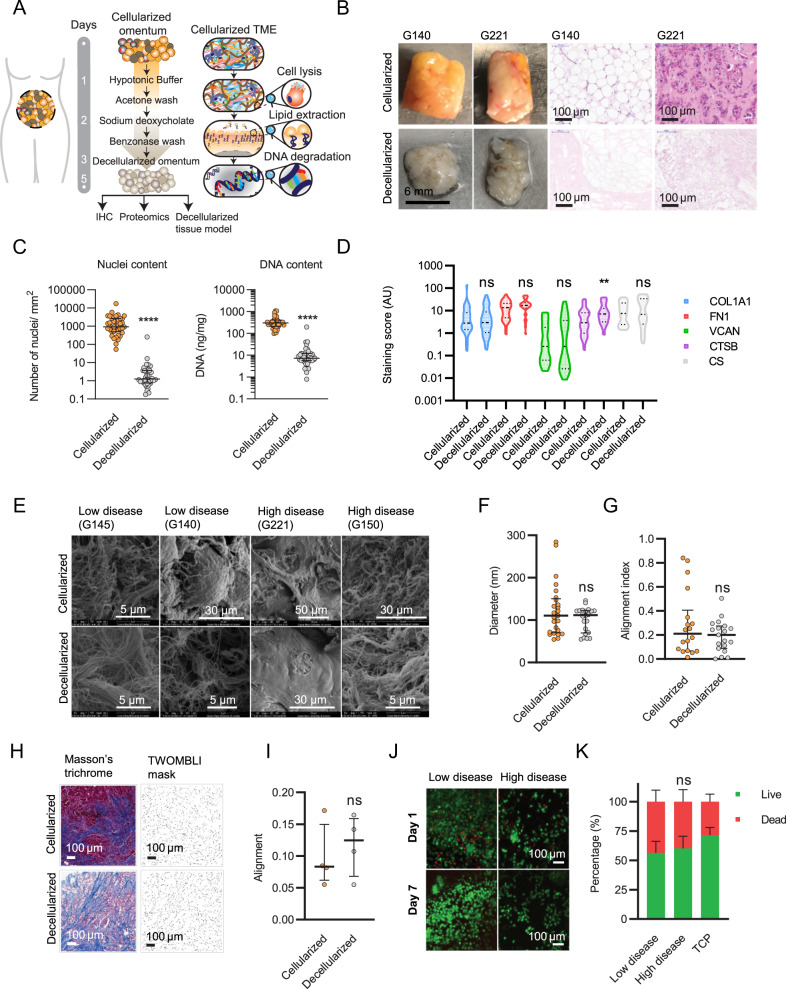
Fig. 2. A decellularized tissue model of ovarian cancer metastasis.
A Schematic of the decellularization procedure and tissue processing. B Fresh tissue biopsies taken from ovarian cancer patients. Histologically uninvolved samples from benign tumors were used as part of the group of low disease tissues. H&E staining of sectioned ovarian cancer samples (G140, G221). Tissue biopsies, Scale bar = 6 mm. H&E, Scale bar = 100 µm. C Nuclei and nucleic acid content in cellularized and decellularized tissue samples. Data are presented as median values +/− interquartile range (IQR). Two-tailed unpaired t test. Nuclei ****p = 0.000085; Nucleic acid content ****p = 1.198 × 10⁻¹³. N = 39 each. D IHC staining analysis using Definiens® digital image software for matrix molecules in cellularized and decellularized samples. Violin plot in which the center line denotes the median value (50th percentile) and dashed lines denote the 25th and 75th percentile. Mixed-effects analysis, with Sidak’s multiple comparisons test, **p = 0.0096. N = 39 per stain. E Representative Scanning Electron Microscopy (SEM) images for cellularized and decellularized samples. N = 6 each. F Quantitative fiber diameter analysis from SEM images. Three to six fields of view were chosen at random in cellularized and matched decellularized tissue micrographs. Data are presented as median values +/− IQR. Two-tailed unpaired t test. N = 6 each. Fiber diameter angles were recorded (minimum 30 fibers quantified per field of view). G Quantitative fiber alignment (alignment index) from SEM images. The alignment index ranges from 0 to 1, with 1 indicating perfect alignment, and 0 indicating disorganized fibers (as described in the methodology). Data are presented as median values +/− IQR. Two-tailed unpaired t test. N = 6 each. H Representative images of cellularized and decellularized tissue stained by Masson’s trichrome stain and representative images of the TWOMBLI mask generated for alignment analysis. Four fields of view were chosen at random. Scale bar = 100 µm. I TWOMBLI analysis showing alignment of collagen fibers stained in blue. Data are presented as median values +/− IQR. Two-tailed unpaired t test. N = 4 tissues. J Representative live (green)/dead (red) immunofluorescence (IF) images from decellularized tissue model cultures using monocytes/macrophages at day 1 and 7. N = 3. Scale bar = 100 µm. K Flow cytometry analysis of viable macrophages collected after 14 days of culture from low disease samples, high disease samples and tissue culture plastic (TCP). Data are presented as mean values +/− standard deviation (SD). Two-way ANOVA with Sidak’s multiple comparisons test. N = 3.

