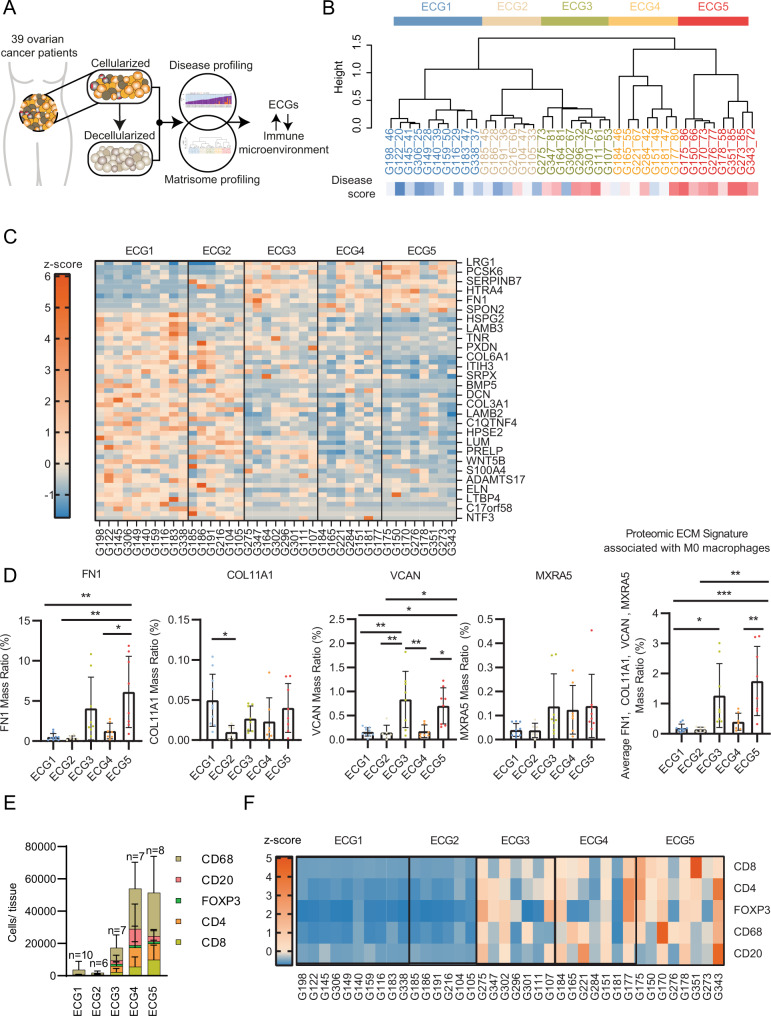
Fig. 3. ECM composition correlates with the immune cell landscape.
A Schematic showing integration analysis using the disease score (disease profiling) and ECM proteomics (matrisome profiling) of ovarian metastatic samples to define the ECM composition and explore the synergy with ECM composition and the immune cell landscape. B Hierarchal unsupervised clustering (ward.D2 method) separated the tissue samples into five groups, based on the samples ECM protein expression, that we have termed as ECM composition groups (ECG) 1–5. Labels: tissue ID _disease score. Disease score (DS) displayed as heatmap from low disease score (blue) to high (red). N = 39 samples. C Heat map using row z-scores of positively and negatively regulated matrisome proteins, columns grouped by ECG1-5. Protein names illustrated for every other row. Full list in source data. N = 39 samples. D Bar plots of protein expression (proteomics) for FN1, VCAN, COL11A1 and MXRA5 in ECG1-5. Data are presented as mean values +/− SD. One-way ANOVA with Tukey’s post-hoc test, significance between each group is presented as **p < 0.01 and *p < 0.05. ECG1 N = 10 samples; ECG2 N = 6 samples; ECG3 N = 8 samples; ECG4 N = 7 samples; ECG5 N = 8 samples. E Immune cells were detected by IHC and analyzed by QuPath; mean number of immune cells/number of tissues between ECG1-5. Data are presented as mean values +/− SD. ECG1 N = 10 samples; ECG2 N = 6 samples; ECG3 N = 7 samples (G164 not included as not enough tissue for this analysis); ECG4 N = 7 samples; ECG5 N = 8 samples. F Row z-scores of IHC immune cells/mm2. ECG1 N = 10 samples; ECG2 N = 6 samples; ECG3 N = 7 samples (G164 not included as not enough tissue for this analysis); ECG4 N = 7 samples; ECG5 N = 8 samples.

