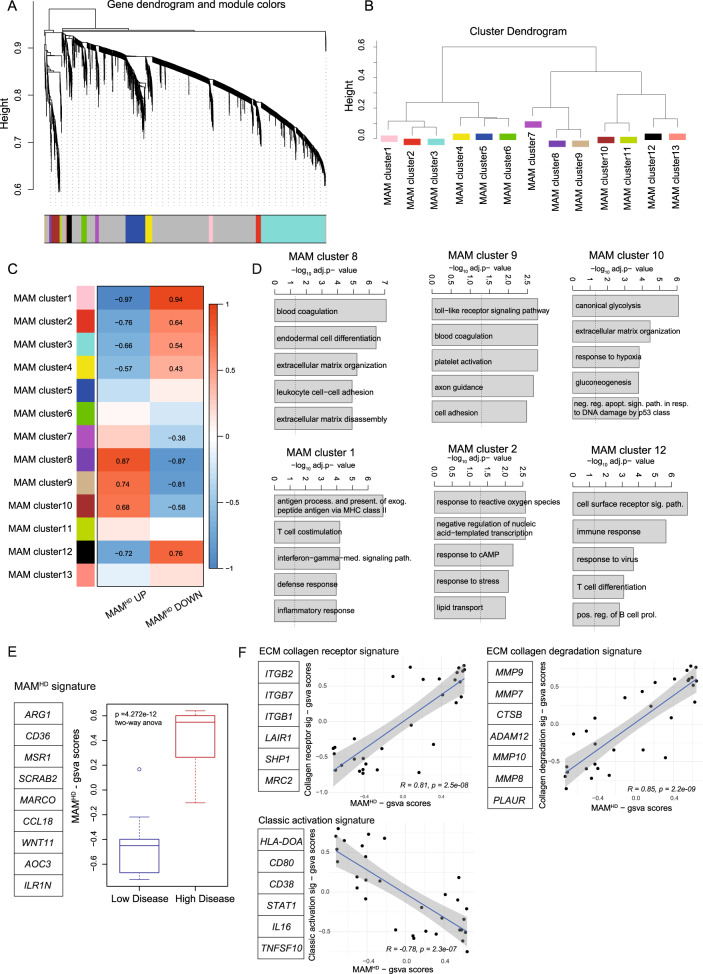
Fig. 5. HD MAMs infer immunoregulatory phenotype.
A WGCNA of human macrophages cultured on HD and LD decellularized tissue showing clusters of co-expressed genes as dendrogram. Numbers indicate different modules (gene programs). N = 16 HD MAM samples, N = 15 LD MAM samples. B Cluster dendrogram of module eigenvalues (MEs) showing associated gene programs from WGCNA of human macrophages cultured on high and low disease decellularized tissue. N = 16 HD MAM samples, N = 15 LD MAM samples. C Heatmap of association of ME with gsva scores of the HD vs. LD, up and down. Pearson’s r-values with two-sided alternative hypothesis testing are noted for the significant correlations p < 0.05. N = 16 HD MAM samples, N = 15 LD MAM samples. D Bar plots for significantly enriched gene ontology biological processes in clusters 8, 9, 10, and 1, 2, 12 gene programs. Broken line denotes adjusted p = 0.05. Hypergeometric test with multiple comparisons correction using the Bonferroni method. N = 16 HD MAM samples, N = 15 LD MAM samples. E Boxplot of selected DE HD MAM genes termed HD MAM signature. Boxplots illustrate median (center of the box) with the upper (Q3: 75th percentile) and lower (Q1: 25th percentile) quartiles (ends of the box); The whiskers correspond to Q3 + 1.5 x Interquartile Range (IQR) to Q1 − 1.5 x IQR; Dots beyond the whiskers show potential outliers. Two-way ANOVA, p = 4.272e−12. N = 16 HD MAM samples, N = 15 LD MAM samples. F Correlation scatter plots of gsva scores from gene lists. GSVA scores were calculated from the MAM RNAseq dataset using the gene lists indicated next to the scatterplots and R package gsva. Correlation coefficient corresponds to Pearson’s correlation. Line was fitted with linear model (lm) with 95% confidence interval displayed. p values and correlation coefficients correspond to Pearson’s method, with two-sided alternative hypothesis testing. N = 16 HD MAM samples, N = 15 LD MAM samples.

