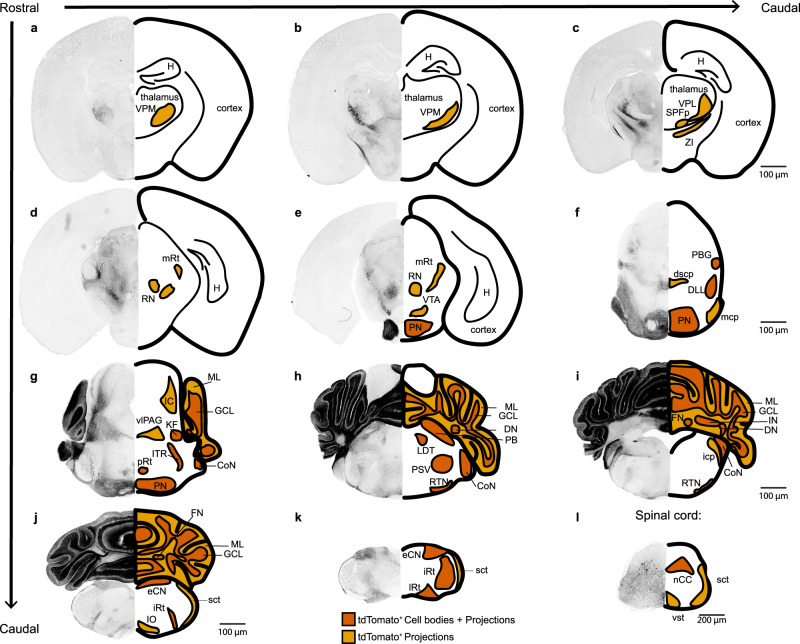
Fig. 4. Intersectional lineage labeling of Atoh1, Vglut2 neurons.
tdTomato+ neuron labeling in Atoh1FlpO/+;Vglut2IRES-Cre/+;Rosa26fsf-lsl-tdTomato mice. Cell bodies are shown in dark orange, projections are shown in light orange. Abbreviations: CoN cochlear nucleus, dscp decussation of dorsal superior cerebellar peduncle, DLL dorsal lateral lemniscus, DN dentate nucleus, eCN external cuneate nucleus, FN fastigial nucleus, GCL granule cell layer, H Hippocampus, IC inferior colliculus, icp inferior cerebellar peduncle, IN interposed nucleus, IO inferior olive, iRt intermediate reticular nucleus, ITR intertrigeminal region, KF Kölliker Fuse, LDT lateral dorsal tegmental nucleus, lRt lateral reticular nucleus, mcp medial cerebellar peduncle, mRt midbrain reticular nucleus, nCC non-Clark’s column, PB parabrachial nucleus, PBG parabigeminal nucleus, PN pontine nuclei, pRt pontine reticular nucleus, PSV principal sensory nucleus of the trigeminal, RN red nucleus, RTN retrotrapezoid nucleus, sct spinocerebellar tract, SPFp subparafascicular nucleus, parvicellular part, vlPAG ventral lateral periaqueductal gray, VPM ventral posteromedial nucleus of the thalamus, VPL ventral posterolateral nucleus of the thalamus, vst ventral spinothalamic tract, VTA ventral tegmental area, ZI zona incerta. Brain images in (a–k) are shown at the same magnification. The spinal cord image in (l) is shown at a different magnification. The light orange brain regions mean that only tdTomato+ projections were observed, and the vermillion brain regions mean the cell bodies (and the projections) were observed. Images are representative of N = 3 mice.

